Transcript
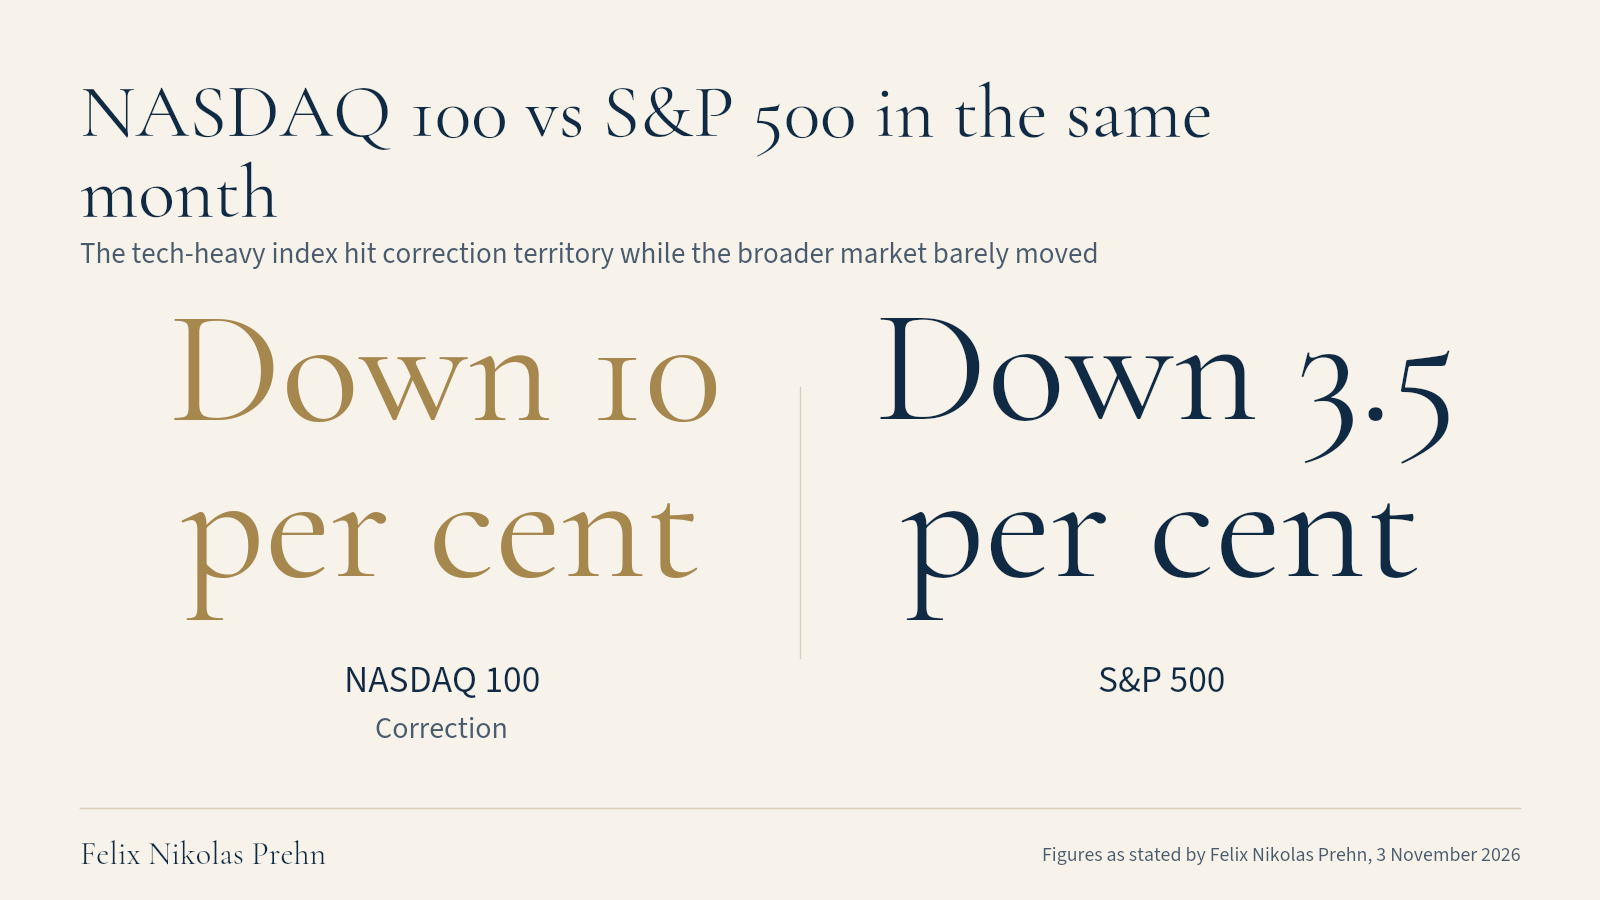
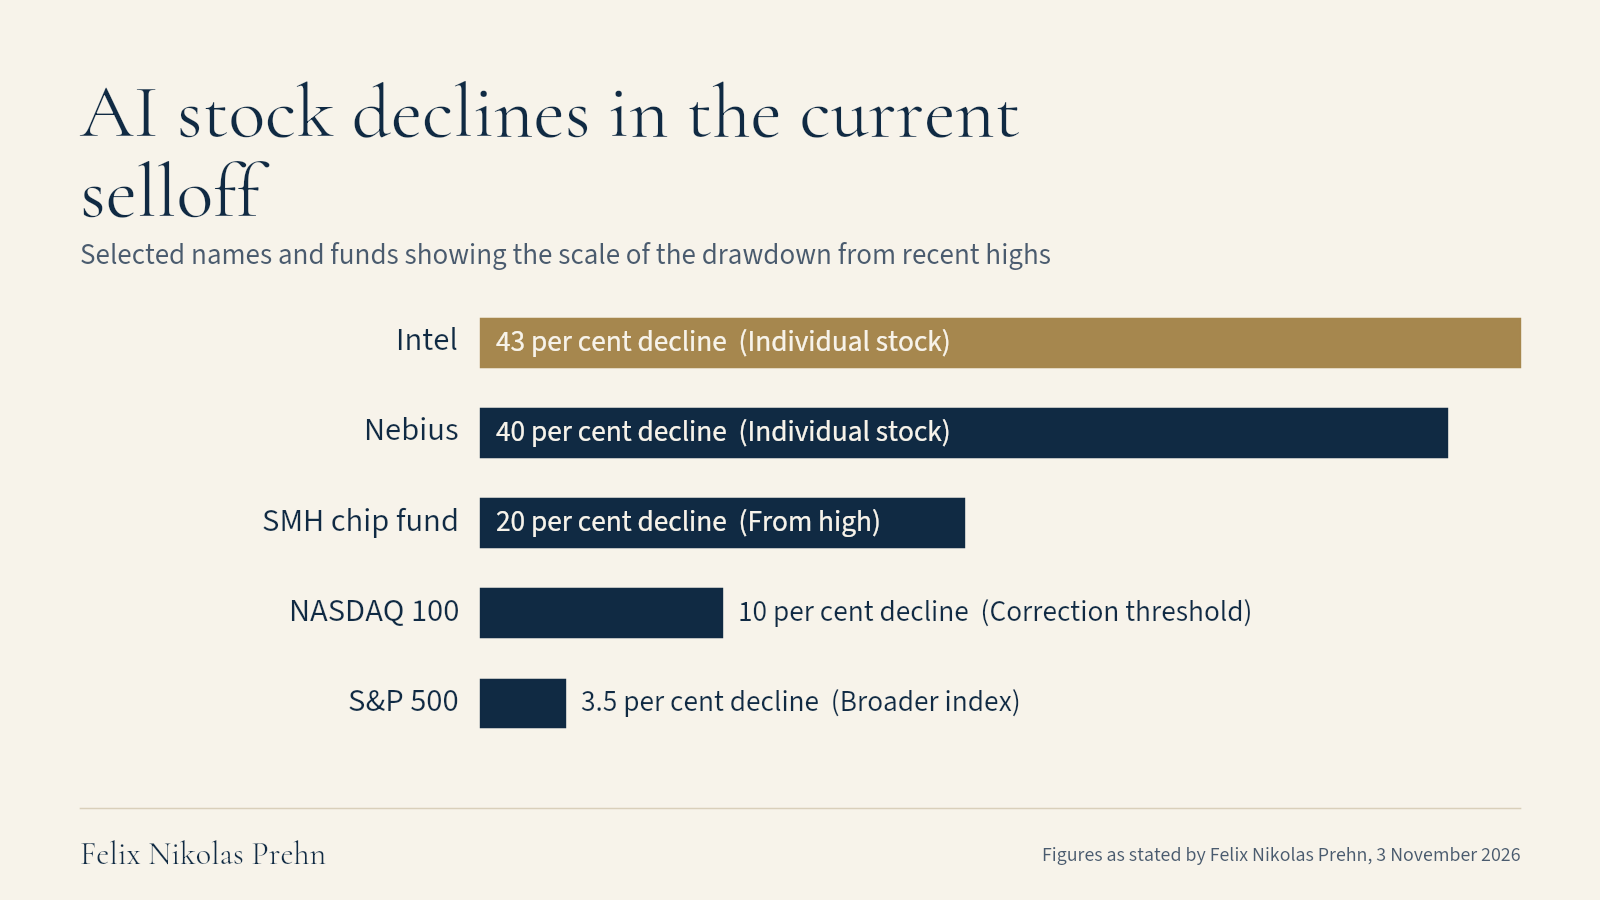
In a month, $ three and a half trillion dollars has been wiped off the biggest AI stocks. Intel's down 43 per cent. Google, Meta, and Nvidia down all by double digits. And the NASDAQ 100, which tracks all those big tech names, is down 10 per cent like this sleepy head over here. But your portfolio might actually look fine because the rest of the market has held up.
Yet, most investors I talk to are scared. Unscared people often sell at the worst moment. And I want to fix that here for you because there's a pattern that's just turned up seven times in the last 70 years. It's about who controls Washington election time. And it could be lining up again within days.
Every time a year later, stocks had done something most people would call unthinkable. But in one of those seven, things got a lot worse. And that one looks a lot like right now. So I want to teach you how to check if your money is in the danger zone and what to do before this gets worse. And whether you're watching this on election day or a week or a month later actually makes no difference because the pattern plays out over two years.
So what do we know? We know the big money on Walt's been selling for weeks. So do they know something that you don't? Well, by the end of this video, you will. So we're not going to panic.
We're going to have an actual plan. If you're wondering who the heck I am, my name is Felix Nicholas Pin. I'm an economist and former investment banker. I'm the founder of the Pin Institute where we publish economic research on financial markets and also provide instructions on how they actually work. I take zero sponsorships, zero endorsements ever, so I can say whatever I like and offend whoever I wish.
Now, there's a lot of stuff going on here at the same time. So, I put all of that research behind this video into a free report. It's got the full list of all the 18 AI stocks that have been hit. Uh the midterms data going all the way back to the 1950s, who won, what stocks did next, the one year this pattern went badly wrong, and and a sample checklist to run over on your own holdings. So, download that.
It's free at felix.org/tech crash. And the link is in the description down below. And there seems to be cat fur hanging off me somewhere which is amuot. Well, actually it isn't. So your index fund is kind of hiding what's going on there.
So if you look at your pension portfolio or something, the damage isn't that obvious because the S&P is only down three and a half per cent.
So if you just looked at that, you think not a lot have happened. The NASDAQ, the 100 top tech stocks, is down 10 per cent. Same market, same month, two very, very different outcomes. How can both be happening if the market is tech dominated? Well, an index is weighted by size and the biggest companies count the most.
And when the money sells out at just a handful of giant tech stocks and moves into the other 490 companies, the tech index falls really hard while the broader index, the S&P barely moves. And you could see it on one day last week. Just one day, the NASDAQ dropped over a per cent. The Dow Jones, which is the sort of older industrial companies, the dusty ones, went up by 0.4 per cent on the same day. So, money doesn't vanish.
It doesn't leave the market. Money moves from one little pot to another little pot seeking to higher returns. But that 10 per cent number on the NASDAQ, that has a name. That's how serious this is. When an index drops 10 per cent from its high, it's called a correction.
It is the word the professionals use. Well, it's the st stage before a proper crash. So, the NASDAQ 100 is there now and people are rightfully frightened. There is a fear index that CNN puts out, apparently the only useful thing they ever produced. It's called the fear and greed index.
It measures how nervous or greedy the market is on a scale of zero to 100. Zero is just blind panic, you know, headless chickens. And as I'm recording this, it's sitting at 23, which is extreme fear. So why does that matter? Because scared people sell and they usually sell near the bottom, not the top.
And just put the damage in in in money for a for a moment because percentages hide the pain. Say you've got $200,000 in a tech heavy fund, which is where a lot of pension money has been ending adding ending up the last few decades. A 10 per cent drop is $20,000 gone. A 20 per cent fall, and some of these names are well past that, is $40,000 gone.
So, it's a, you know, a kitchen you don't get to redo. Oh my god, the pain. But no, more seriously, it's a year of retirement that you don't have to work. And the people that who hurts this the most are not actually the gamblers, the GameStop lunatics. No, it's your 55year-old person who's done everything right.
They put their money in a big fund years ago. They set it. They forgot about it and they got on with their life and they wanted to retire now and now they're like, "Ouch." Because the fund was weighted towards the winners of the past. So, they're holding the exact stocks that are falling the fastest and they've got no idea why. So, that's the first thing you want to you want to check and you can do that again go in the Winston app link down below.
And and we have a filter called the danger zone. uh and and and you type in what you own and it flags the names carrying the most risk right now. And some of the stocks screaming at the top are the ones you've already heard about. Coreweave down, Nebia's down 40 per cent, Intel cut in half, right, which is the same as 50 per cent, but I thought we may want to make the presentation a bit more interesting. Minus 50 per cent halfed. Yes, very smart people making my slides.
So spotting that before everybody else is what? It's a skill. It's not a crystal ball. It's a skill. Skill you haven't been taught.
Why have you not been taught it?
Well, the industry makes a lot of money out of you feeling really scared. So you buy their index funds and whatever products they want to sell you and they collect fees. That's basically the way Wall Street makes money out of you. And in my humble opinion, the selloff isn't over. And I think you need to hear it plainly.
It might pause. It might even bounce for a while and tempt everyone back in. That's usually what happens. But when the real move comes, and I think it will, it won't be a few per cent. It'll hit you hard.
And it'll hit the people who felt safest because the index look calm right up until it did not. And the ones who get hurt are the people still clinging to the last cycle's winners or the money is already moving to somewhere new. And I don't want that to be you. So, this is what I'm going to do about it. This Saturday, I'm going to run a free live training called the Great Pivot.
Two hours live on Zoom, no charge, just free information, free education, and I'll teach you how to tell when the leadership in the market is changing, how to check the stocks that you already own, and how to build a plan for both outcomes, whoever ends up running Washington, which we will know by then, which will be helpful. So my goal is not to give you a long stock list and say go and rather than buy these because that list will expire in a few days. My goal is to give you the skill so you can make your own list for this pivot and for the next one because there is always another pivot. So grab yourself a ticket. It's free at green pivot greatpivot.org even link again is in the description down below and I'll show you the exact uh setup there. uh that'll work for you if you're in the US, if you're in Europe, even if you're in Asia, if you're in uh down under, you might have to stay up a little bit later, ask for permission, you know, that sort of thing.
If you're not a grownup yet, but it's live. There is no replay. So, if you really really want to learn, show up. If you don't, you know, go do something else. So, why is AI cracked right now after two years of basically going up in a in a straight line?
Well, start with price.
AI got expensive. When a share price climbs far faster than the company's actual profits, you're paying more and more for every dollar it really earns. And that's fine, but everyone believes the profits are coming. They're coming. I promise you, they're coming.
The moment that belief wobbles just a little bit. Wobble is a wonderful word, isn't it? The most expensive stocks tend to fall the hardest. And the AI leaders are some of the most expensive stocks in the world. And then there is spending.
These companies are pouring tens of billions of dollars into data centres and ships. Actually, it's hundreds of billions to build out AI and investors were like woohoo for two years. This earning season, the mood flipped a little and the big names reported the last results. The market started punishing the ones spending the most and asked the obvious question, when does all this money actually come back as profit? And that's how a company could post a really strong looking result and still watch it share price drop 20 per cent 30 per cent the next morning.
And then the third part to this is the backdrop. The interest rate the American government yes those buggers pay to borrow for 10 years sets the tone for everything else. And so their tone isn't very polite right now. When that rate is high and a safe, well, allegedly safe government bond pays you a decent return, it starts to look more attractive than that risky, expensive tech stock whose payoff is, you know, who knows when. And then you add a nervous oil price on top, you know, the conflict in the Middle East keeping energy costs twitchy, and you've got exactly the setting where the crowd heads for the exit on the names that ran out the most.
And you can watch this split in real time. Go to In Snap link free link down below. Pull up Nvidia. Pull up Google's parent and pull up the big chip funds which trades under the ticker SMH. The chip fund alone is down close to 20 per cent from its high.
These were the the generals of the whole bull market. And right now the generals are well they're retreating or they're asleep in a ditch somewhere. And this does not mean AI is finished. net. It just means the price got ahead of the reality and the market is repricing as in delaying your retirement. The question is always whether something tips that repricing into something much worse.
And there is a very big something on the calendar because today is America's voting day. Today America picks who writes the rules for the next two years. And election results might already be out. So you can skip fast forward 30 seconds. But the lesson from this is still valid because a blocked Washington suits Wall Street.
So let's talk about the vote very plainly because you know the title kind of alludes to it. Right now as of last week Republicans held both both chambers. In the House represent representatives it's 218 Republicans 214 Democrats and one very confused independent and a couple of empty seats. In the Senate, it's 53 Republicans and 45 Democrats, plus two people looking for that special bathroom. Um, and they tend to vote with the Democrats.
And then today, all 435 House seats are on the ballot along with 35 Senate seats. So, for the Democrats to take the Senate, they need just four more seats essentially. If it lands at 50/50, the the vice presidente vans breaks the tie. So, the House comes down to a handful of seats either way. Who's favored?
Well, heading into today, the Democrats are favored by the nitwits that run polls. But let's just assume you're watching this and the results are already out, okay? So, we don't need to try and predict what's going to happen because no one's got any freaking idea anyway. Congress has to fund the government by 11th of December or you're going to get a shutdown. Very important date.
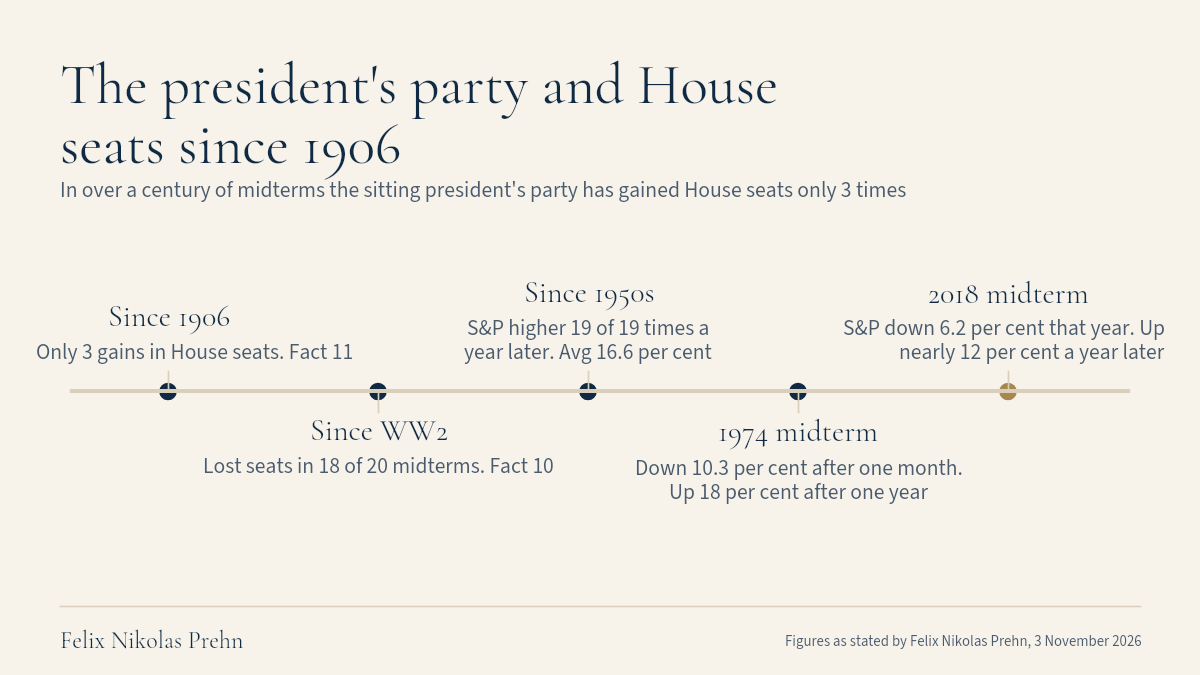
But honestly, most people get midterms badly wrong. They treat them as a coin toss. They're actually not. The party of El Presidente, whoever he happens to be at the time, has lost seats in the House in 18 of the last 20 midterms since the Second World War. Going back further, it's gained House seats only three times since 1906.
So, a split Washington after today is not a shock. It's kind of the expectation. It is a boring historical pattern outcome. And that brings us to the money, your money, which is what you actually care about, right?
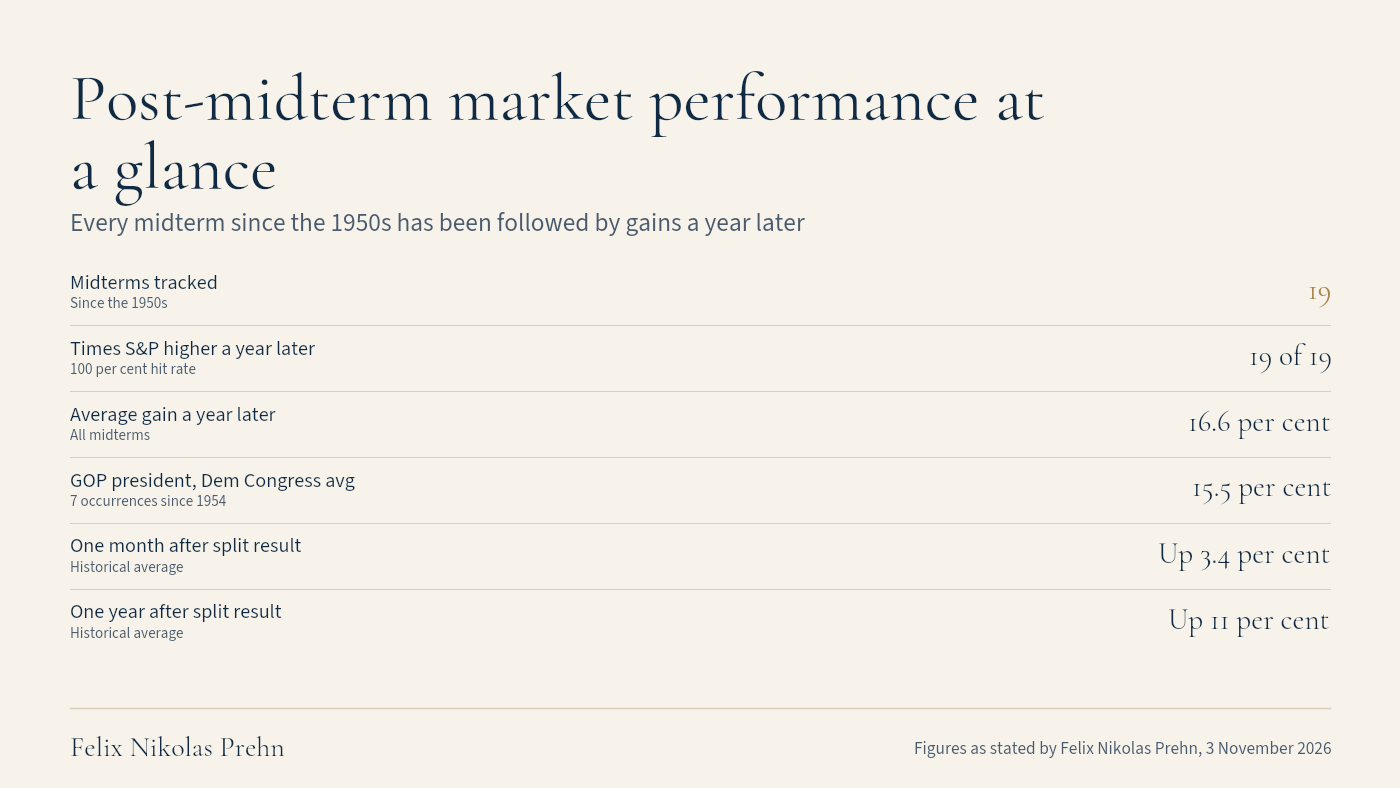
That's why you're still here. Start with the simplest factor. After every single one of the 19 midterms since the 1950s, the S&P 500 was higher a year later. On average, 16.6 per cent higher. Let's pop out the champagne.
Did it matter which party won? No, honestly. Um, no matter which party wins, the market goes up. Now, the setup America might get today is a very specific one. It is one with a Republican president that ones are given um with a Democratic Congress which is speculation but it's the pattern from the start well of all the data.
It's happened seven times since 1954. Now stocks were up all seven times by about 15.5 per cent on average which is still pretty freaking decent if you ask me. And the day after it tends to dip because EVERYONE'S LIKE OH NO rights I guess. and and and well, most of Wall Street is fairly Republican because, you know, they want lower taxes because they got lots of money.
A month later, the market's up 3.4 per cent. A year later, it's up 11 per cent. So, we kind of got over the first thing. Why does that happen? Why does a blocked Washington suit the suits on Wall Street?
This is the bit worth understanding because it's completely counter to how most people feel. When the White House and Congress are run by different parties, very few big new ideas get through. Nobody can push a huge change on their own. Tax rates mostly stay where they are. Regulation mostly stays where it is.
And that is more what a business would want. A company can plan its spending, its hiring, and its prices for the next two years knowing the rules aren't about to move under their feet. Think of a landlord who can't change your rent or house rules for two years. But you might not love the rent, but you can plan your life around. And Wall Street will pay more for a company where it can see further ahead because less change means less risk to worry about.
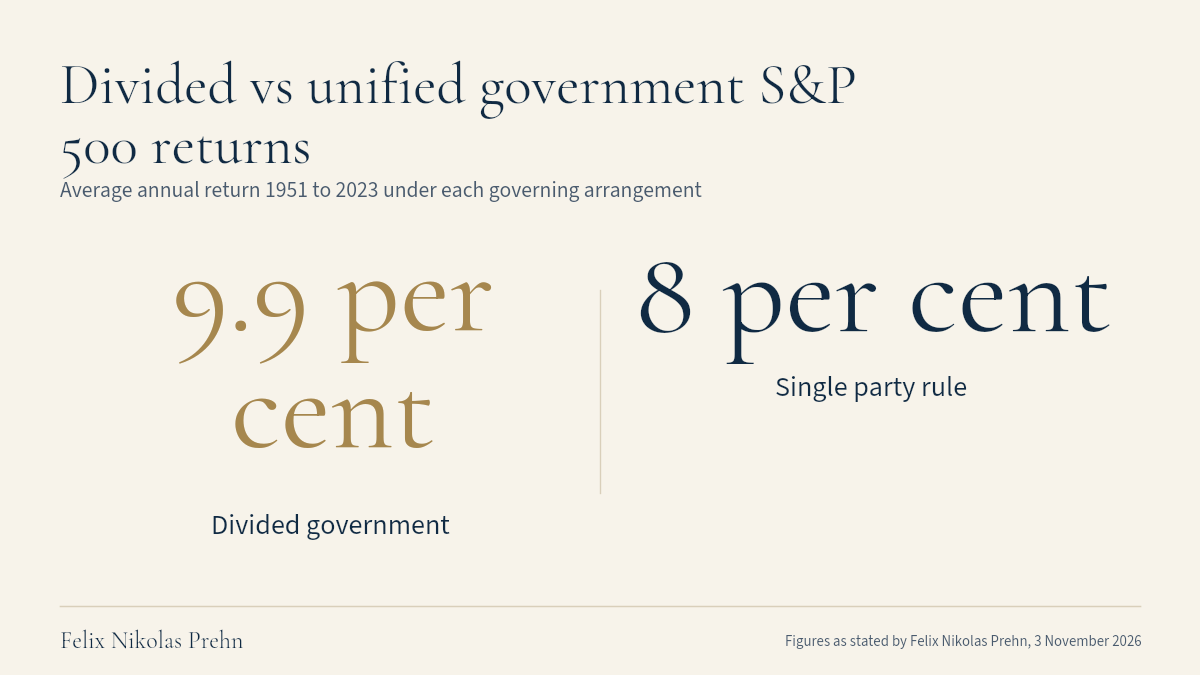
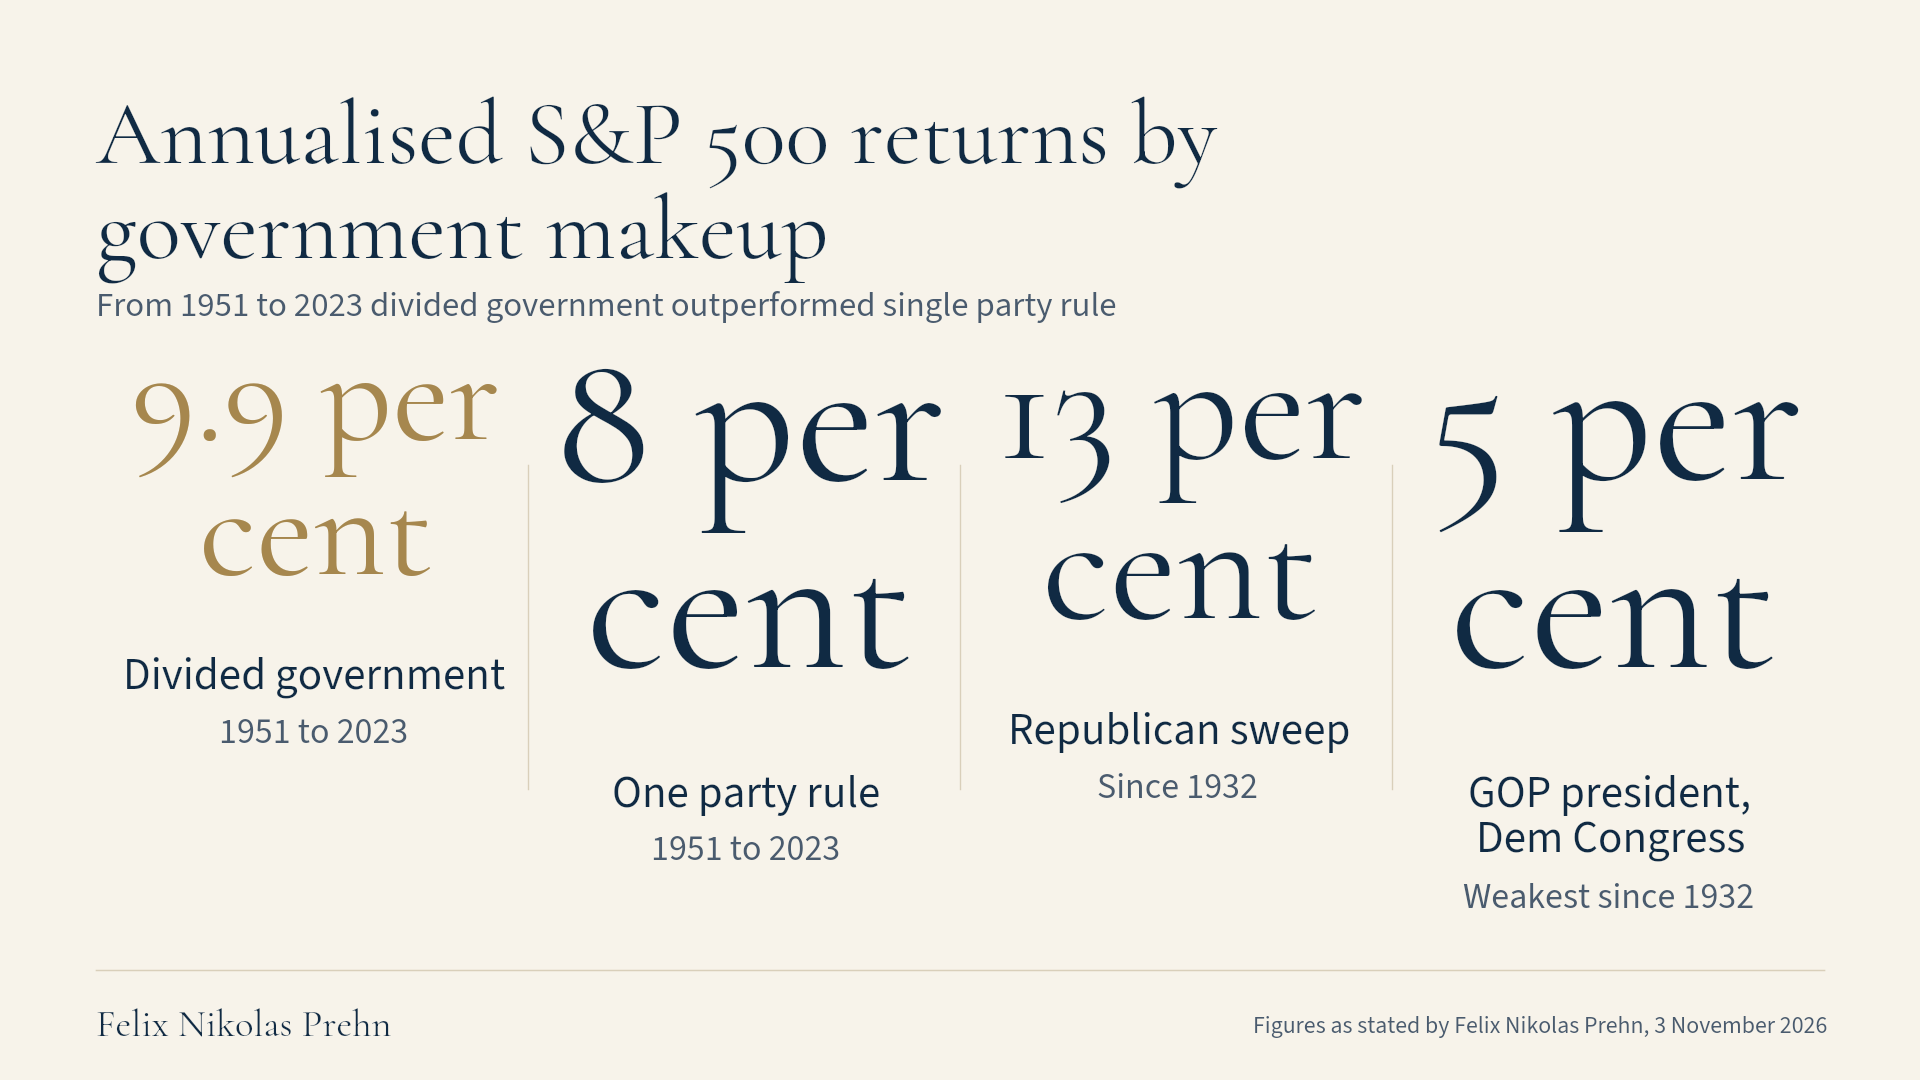
And the numbers literally back it up. From 1951 to 2023, the S&P 500 returned 9.9 per cent a year under a divided government against 8 per cent under one party rule. So after elections that left no single party fully in charge, the market averaged more. So gridlock, yay, it lowers one risk, but it doesn't remove the others. So don't just tune off here because the big other risk this time is a and I and the read doing the rounds on Wall Street and I'll flag but this is opinion and not fact is that a democratic sweep of both chambers would almost certainly pressure the AI buildout and could lead to more pullback in those names.
On the other side, plenty of strategists reckon that as long as the AI wave keeps rolling and the economy keeps growing, the bull market is probably alive and well. Now, I think the honest version of this is seasonality ain't destiny. And the and the worries around AI and oil won't just vanish because it's another day, right? Elections behind us. We got a 2018 warning, pretty recent one.
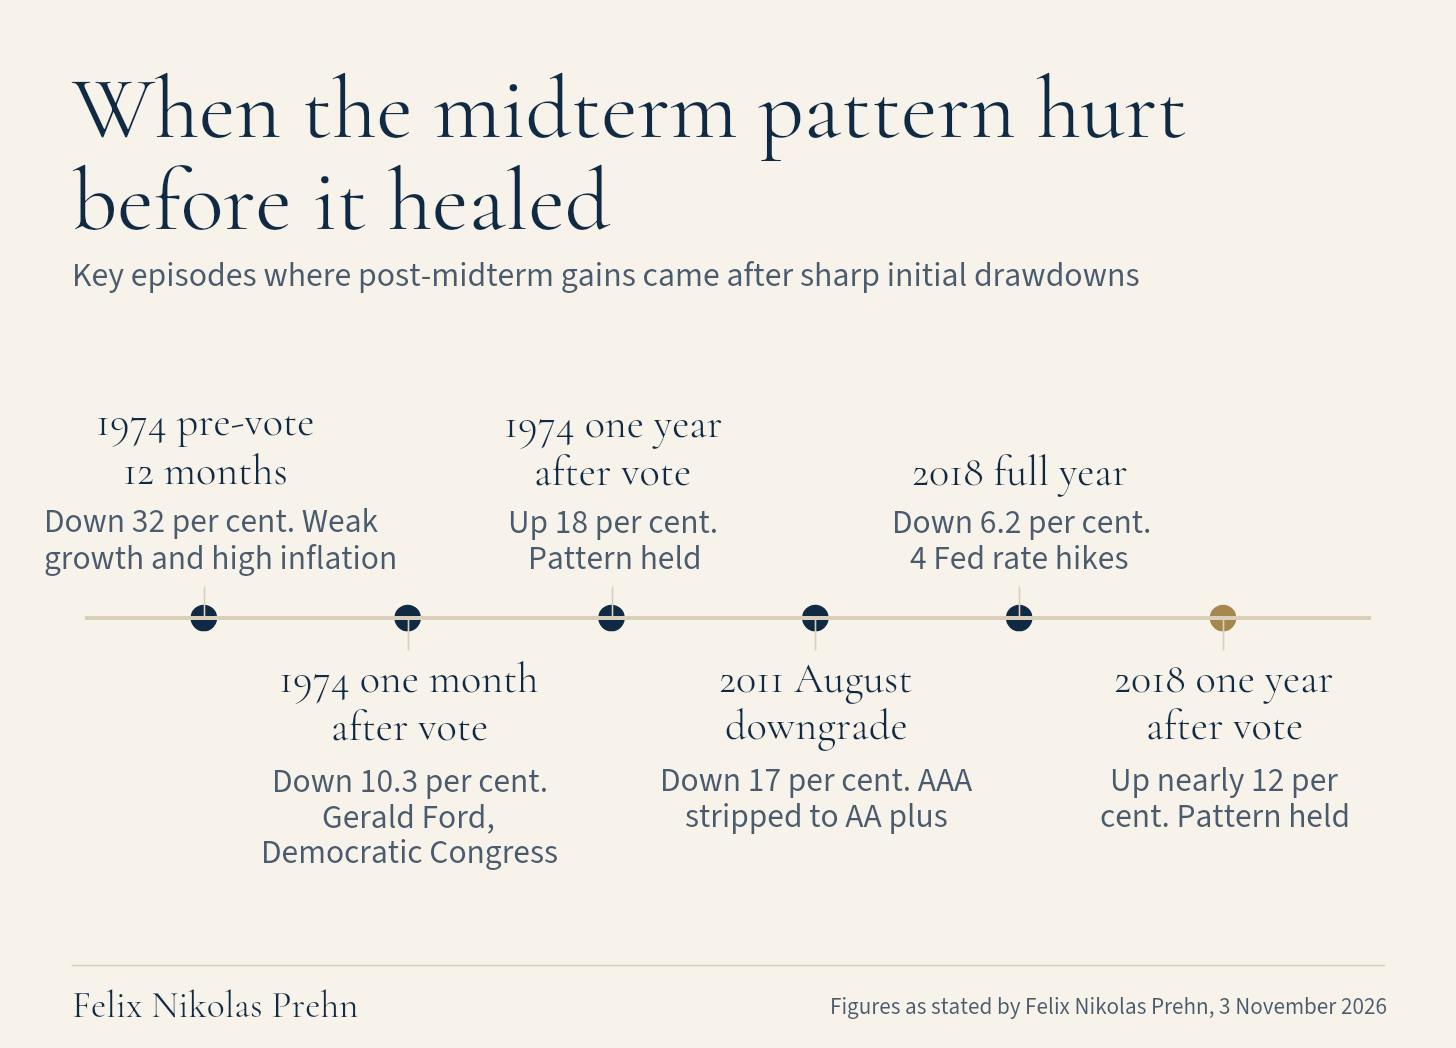
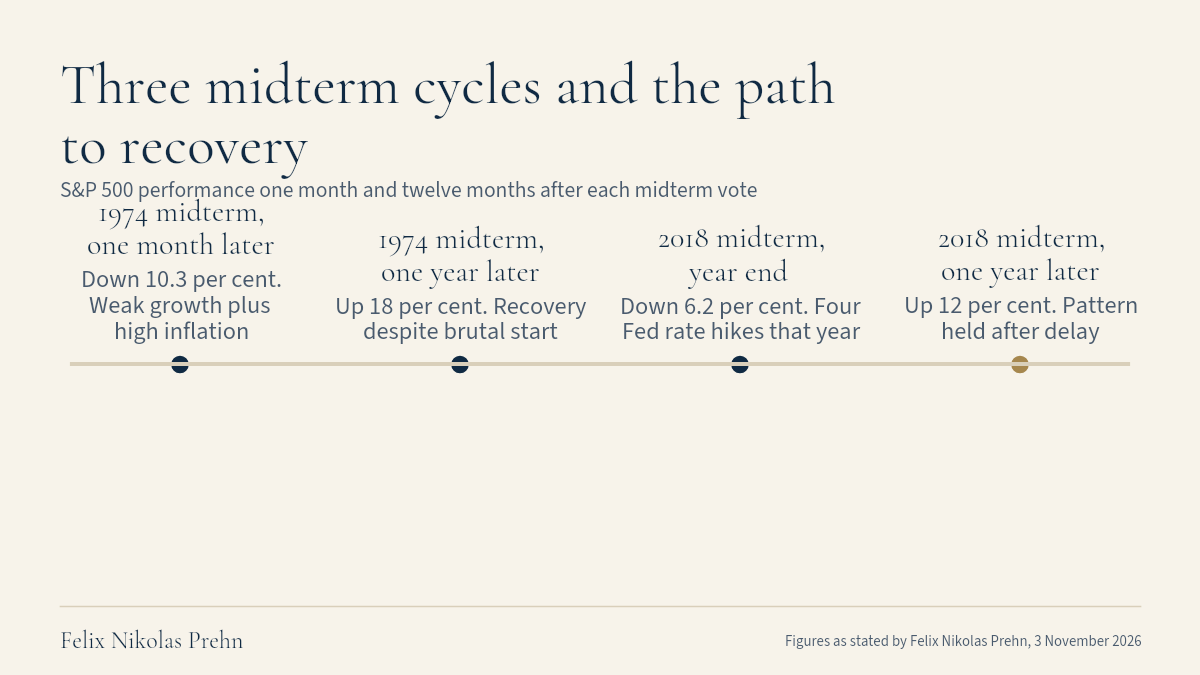
The Democrats took the House, textbook split result, but the Federal Reserve raised interest rates four times that year. And the S&P, it finished down 6.2 per cent. And then true to the pattern, it was up nearly 12 per cent a year after the vote, the election pattern actually held.
So the path there still hurt plenty of people who got scared out of it, which is exactly where we need to go next in act four. Because there is one year out of those seven midterms we looked at since World War II that didn't go up smoothly. It went down really hard first and it's the year that looks almost identical to right now. When Gerald Ford was in the White House and I mean I've seen a picture of the man but I don't know anything about him. Um you had a Democratic Congress and it's the only one of the seven that was lower a month after the vote.
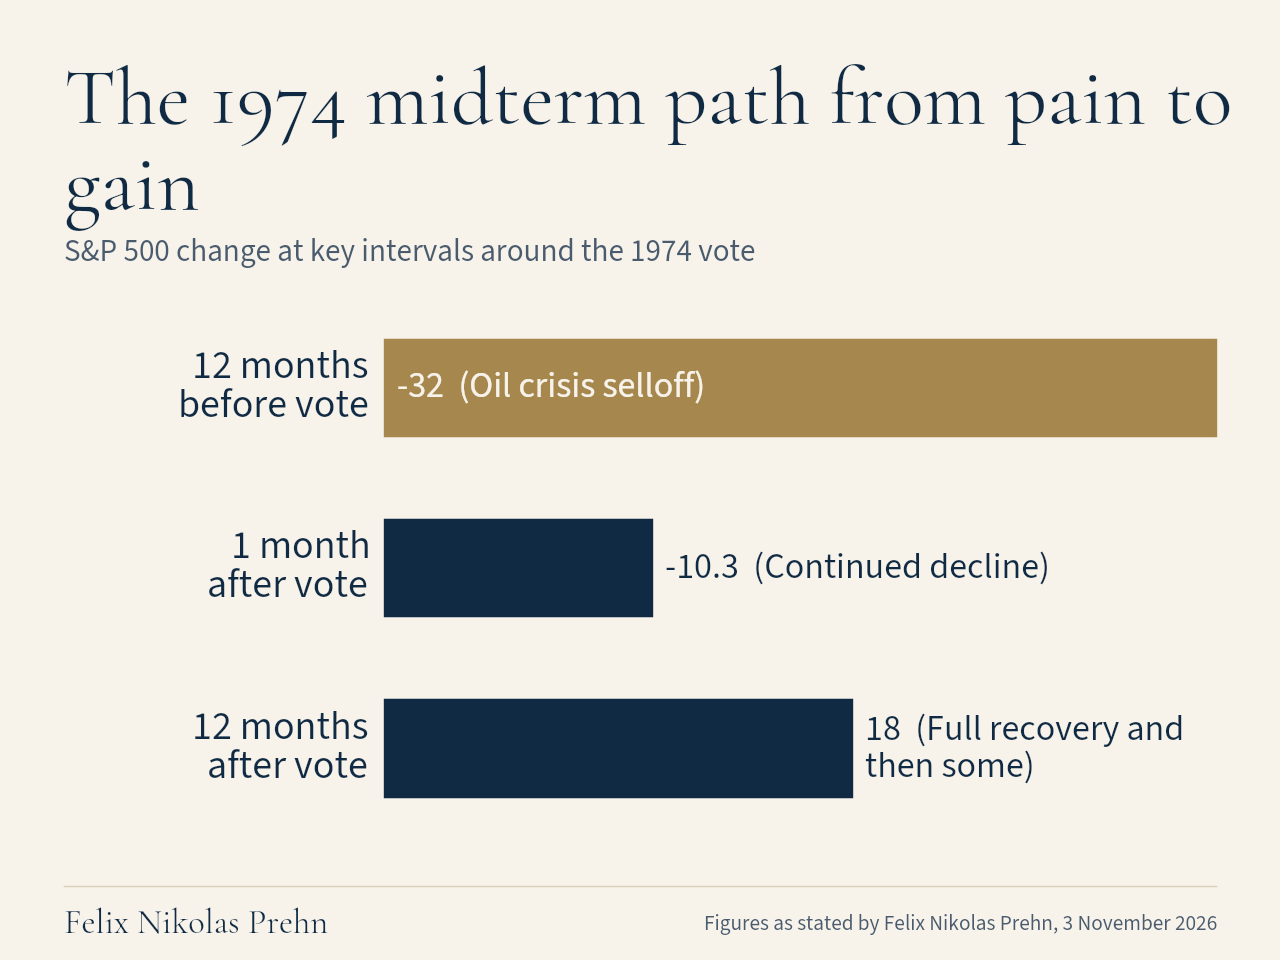
We went down 10.3 per cent after the vote and then it recovered a year on and we were back up to 18 per cent. But that first month it was brutal and the months before it were actually worse. In the 12 months leading into that vote, American stocks fell 32 per cent. So what made 1974 so ugly? Weak growth and high inflation at the same time, largely driven by high oil prices. any of that rhymes with anything that you've heard about in the last few months?
Well, you know, there was a conflict in the Middle East, inflation that wouldn't really just lie down. Um, and RBC, the Royal Bank of Canada, did actually something useful for once, and they looked at this specifically, and what was their conclusion? That the pattern I just told you still worked more than it failed. It just came with a really rough ride at the beginning. And then there's the other gridlock which could bite us here.
It's 2011 split Congress, Democratic president. So it should have been a calm market friendly setup, right? Instead, Washington turned a routine vote to raise the debt ceiling into a standoff. On 5th of August 2011, the rating agency S&P stripped America of its AAA rating. It dropped it to an AA plus, which is sort of like a bed and breakfast hotel that you don't want to stay in because it's got bed bucks.
And it blamed what had called political brinksmanship, whatever that means. And the market did what? The market dropped 17 per cent. And the modern version of that exact risk is sitting on the calendar right now. Mark this down.
The government funding deadline is the 11th of December. And I wanted to include this because I want to be honest with you here. A Republican president with a Democratic Congress is the weakest combination that we have on record since 1932.
About 5 per cent a year return on the market against roughly 13 per cent for Republican sweep and 10 per cent for a Democratic one. So both things are still true at the same time. The year after midterm has still been pretty decent, but the whole two-year stretch for this particular setup has been the slowest of the lot. And I think that's the real lesson here. The pattern can be completely right and still hurt you first.
Which is why the plan I'm going to give you uses alerts, not panic selling. And why it starts with checking what you actually own before the result even lands. So if it's already landed well, you can still check it. I'm not saying this is going to end badly. By the way, the strongest version of the other argument goes like this, and it's the one you'll hear from parts of Wall Street right now.
The argument is that Wall Street is pricing the wrong future entirely. that interest rates come down and not up, that the 10-year government borrowing rate is going to drift down to 4 per cent. The S&P is going to climb up um to, you know, 10,000 points or something by the end of next year. Um and that oil price is going to go down, the war is going to stop, everyone's going to love each other, and then, you know, it's all going to be marvelous. And I hope that's true. I'm just a little bit of a cynic and perhaps realist because I like to plan for worst case outcomes.
I always ask myself one question. What if you are really really wrong, Felix? What if you're terribly wrong on everything? What is going to happen to you? And if you plan for that, only good things happen to you.
So check every holding that you own against our danger zone filter in the Winston app. Links down below. It's free. Don't trade the election result. You don't use your money to vote with your politics.
The two are not connected. Okay? Your money is there to make give you freedom, give you options, give your family freedom and security. It has nothing to do with whether you like someone in red or blue or purple or green or whatever you you you prefer. And get good information.
I get a bunch of alerts on my phone, wherever it might be, that tell me what's going on. And it tells me specific things that actually matter to me because it'll only give me alerts to the stocks that I actually own. It'll tell me the sector rotation where the money is actually flowing. And if you go with a trader kind of interestingly, it tells me when the insiders, the guys running the companies that I own, when they're selling or when they're buying. And particularly, I want to know when they're flipping.
So every single stock I own, I can see what's going on here. They're selling, selling, selling. And suddenly these guys started buying. I'm not saying you should therefore run out and buy the stock, whatever it is, but it's kind of an interesting piece of information to know, isn't it? So with that, again, get yourself the free trial down the line.
And I put on the screen here, I'm not telling you to go and buy gold here, and I didn't mean that. Uh, but with everything that's going on in the world and the money printing, and there'll be more money printing no matter what happens with elections and and markets, it's the only way to deal with the inflation.
Uh, sorry, the debt. Inflation is the way to deal with the debt. in gold is the one thing that tends to do well with high inflation. And gold's frustrating right now. I totally get it. Why is that?
Well, in my humble opinion, a lot of Middle Eastern countries are selling gold. But the one thing that's for sure is that money will continue to rotate between different sectors. It was leading technology, was leaving energy yesterday. Where did it go? Consumer discretionary, consumer staples, materials, banks, right?
And there's some use in looking at our data afterwards. But unless you really really understand how this great big pivot works and once all the money is in one thing already, tech and AI, what happens when the big boys start selling? Who do they sell it to? Well, you. But they're not as many of you as there are, you know, billion dollar funds on Wall Street.
So they they have to dump it at discounted prices. And that's why you get these wild swing reactions when everybody is already crowded into the same trade, right? It's a football stadium with one door and everyone's trying to leave. So, I call it the great pivot and I'm going to teach you how to read this, how to prepare for it this coming Saturday. It's completely free of charge and you can go come and join us at greatpivot.org.
And if you're going to get some value out of that or I got some value out of this video here, then um share it and keep learning. I wish you all the best. >> Right now, I think we're going through some sort of weird phase transition. And normally when you get bad economic news or you get bad jobs data that people are going to fly to safety into the bond.