Transcript
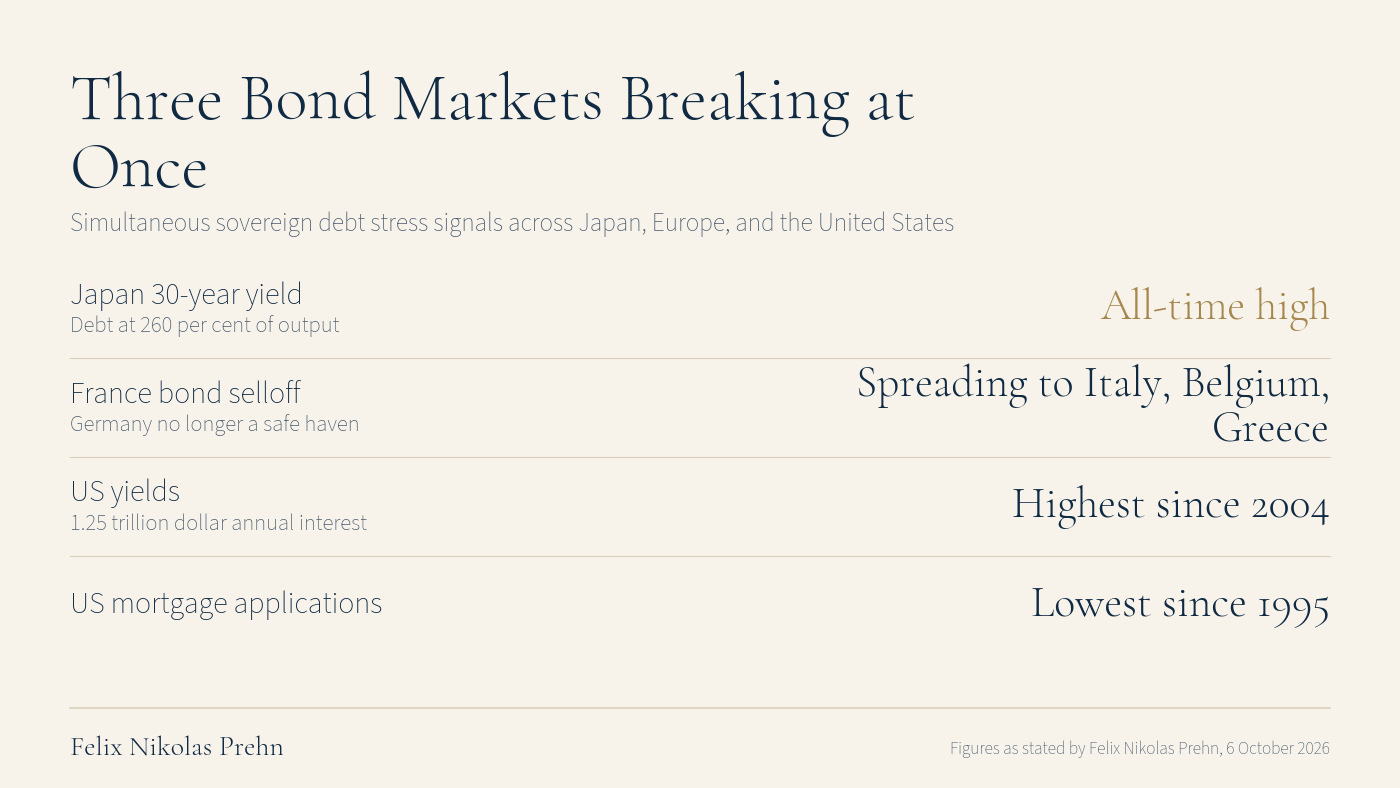
Japan's 30-year bond yield just hit the highest it has ever been in the history of the Japanese financial system. Europe's cracking with it. France's bond selloff is spreading to Italy, Belgium, and Greece. And in America, mortgage applications just hit their lowest level since 1995.
And of course, gold's falling with it, which is why this guy is upset and facing the other way because he's a golden retriever. And all of these stories are not separate stories. They are the same story. It's not a housing story, a Japan story or a gold story or a debt story. It is all one. So if you hold gold and you woke up this week and watched a drop, horrible drop again, right? And you're sitting there thinking, "Wait, if the bond market's breaking as a war or a couple, isn't gold meant to protect me? Why is it going the wrong way?" then stay with me because what I found when I went looking for the real reason is what this video is about.
And at the same time, if you go on social media, some people are talking about gold at $50,000. And that makes you go, "What, is that actually possible?" Sounds a bit insane. So let's see the maths behind it. And by the end of this video, you actually will. You're wondering who the heck I am. My name is Felix Nikolas Prehn. I'm an economist and former investment banker and the founder of the Prehn Institute where we publish research on financial markets and provide instructions on how they actually work. There is no sponsorship here. There is no endorsements ever. And that means I can say whatever I like.
And of course this is Winston down here. He had to lie down because the whole gold thing is shaking him up a little bit. And before we get into it, I'm going to throw quite a lot of numbers and concepts at you. And if you are like me and you don't want to scroll past that but actually really understand it, then you can also download and read our free research report on this that lays out exactly what I'm walking you through here, how it's affecting your savings and your assets and gold and everything else. There is no pitch in it. I'm not selling you anything in it. Just download it for free at felix.org/goldreset and then come back and watch the rest of this video.
So let's understand the dominoes that are affecting this here. And we're going to start with Japan because it's the warning the rest of the world keeps ignoring. The Japan 30-year government bond yield, the interest the Japanese government has to pay for 30-year debt it issues, is at an all-time high. Not a 10-year high or high since the crash or something. No, the highest ever. And it matters because Japan carries the highest debt load of any major economy on Earth, about 260% of its annual output.
And for decades, it got away with that by keeping interest rates at basically zero, and then buying its own debt. And that works right until it doesn't. And now the bond market is forcing Japanese hands. Yields are climbing, which is real interest rate, even though the Bank of Japan would give almost anything to keep them down because the buyers are backing away. And when the most indebted large economy on the planet starts losing control of its own borrowing cost, it isn't a Japanese problem. It is our first domino. Remember that one.
If you're thinking about pizza, your mind is obviously wired like mine. Now let's look at Europe, the aging, sick continent, because they are the second domino. France's government's bonds are selling off and this selloff is spreading. Yes, Italy, Belgium, Greece is being infected by the French disease and France is literally at the centre of it borrowing too much. A political system that can't agree on a budget and there is zero plan to close it.
And it's exactly what we saw when we had the Eurozone crisis a decade ago with one difference and it should worry you a little bit more not less. Last time Germany was the safe haven everybody ran to. This time German yields are rising as well. So the safe room is on fire too, literally. And we're not worried here about Greece. No offence to the Greeks but it's a smaller economy. We're talking about France, Italy, Germany, Belgium, the major industrial nations of Europe.
And I know some of you are thinking, "Oh, I don't know. I'm American. This is outside America. Who gives a hoot?" Okay, I get that. But US yields are the highest they've been since 2004. The interest the American government now pays on its debt is $1.25 trillion a year, almost everything you spend on social security. And imagine that in your life. Imagine if the interest on your credit card, the one you weren't paying off, which I hope you do. That interest was the biggest expenditure you had as a family, bigger than your mortgage, bigger than your food. That's where the government is in the US, and it's the biggest government in the world.
And of course, the official story is that yields are rising because the economy is strong. Well, if that were true, explain this. Why are yields rising at the same time in Japan and France and in Italy and in countries whose economies are weakening and not strengthening? A strong economy does not explain this global move. Something else does. Too much debt everywhere all at once and a bond market that stopped believing the people who issued the debt.
Which brings us to the question you actually came for. The bond market is breaking. If this is the setup for a crisis, why is gold going down? Gold's supposed to be the hedge, right? And this week again it fell. There are three reasons and none of them are the one you're actually afraid of. First, the dollar. Gold is priced in dollars. When the market expects interest rates to stay higher for longer, the dollar strengthens and a stronger dollar pushes the gold price down for everybody outside of America. Yes, there are people outside of America. Just saying that to my American friends. It is mechanical. It is not a verdict on gold. It just makes it for people like me who are outside of America, it is more expensive for us to buy gold because we have to buy dollars first and the dollar got more expensive.
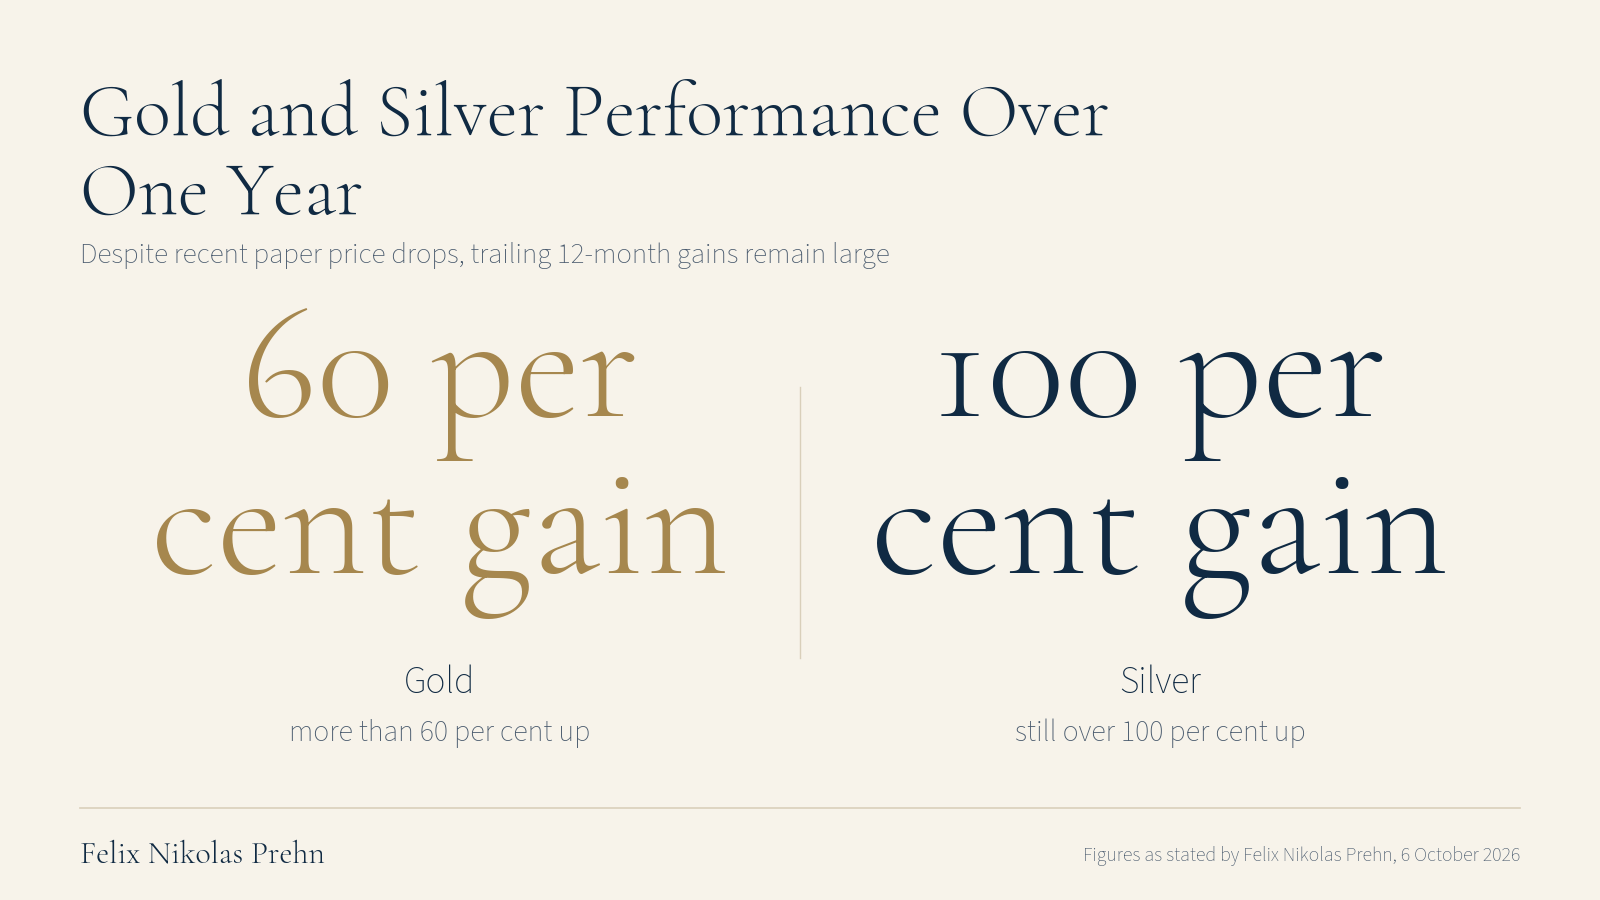
And then the trade got a little crowded. Gold is up more than 60% in a year. Silver is up still over 100%. The trade runs that hard, almost everybody who wants in is basically in. And that brings me to the third reason which people don't seem to talk about. I made a whole video on how the silver market works and the way the paper price gets pushed around and the same pattern is on in gold right now. Margin requirements get raised which forces leveraged holders to sell. The selling triggers automatic stop losses which triggers more selling. It's a cascade. So the paper price on screen can drop hard while the actual physical metal is still there. So the paper price is what you see when you watch the gold price on your screen. It is not really the price of gold.
So you are starting to get this, right? The debt isn't going to be repaid. The interest alone is eating the budget. They're not going to default in the way most people picture it. They're going to inflate it away slowly, quietly, while you're watching the headlines about trade wars and AI stocks and all sorts of nonsense. The money printing is here. The broad money supply is growing at the fastest pace in 4 years. Every major central bank is quietly printing money. And the bond market just told you that it doesn't believe a word of the official story.
And that's the good news. As strange as that sounds, the problem is this. You now understand why gold fell and why that drop changes nothing about where this is heading. You understand the structure of how to actually protect your money from it. But understanding the structure and actually protecting your money from it are two very different things. Because do you know which assets move first when the money printing accelerates, which it will? Do you know the signal that tells you the devaluation wave is about to hit? Do you know which sectors the big institutions have already been loading up on for the last 6 months?
Well, most people are watching videos about tariffs or war or AI or something. Well, they do. They know the sequence. They've been in this trade since before the bond market cracked. And by the time the news runs a segment on it, well, you're the exit liquidity, which is what financial institutions call us retail investors. And that's why I want to teach this to you because I think it's the most important thing facing this generation right now. Literally, there is nothing more important, I believe.
So I'm going to run a free live session on this for you, and I call it the greatest stock market opportunity before the end of the year because it's actually an opportunity. It isn't a calamity if you know what's going on. And I'm going to walk you through the exact playbook. The big money uses when government prints, which assets move first, which move last, how you get positioned before the herd. And that's the piece everyone seems to be missing. It's going to be live. It's going to be free. There is no replay. So whether you're in America or in Europe, you can show up. There's a link down below in the description, it's at thegreatestplaybook.com. And let me know if you're serious about doing this for yourself. Just write serious in the comments and we'll spook the algorithm with all the serious comments and see what happens there.
But let's touch back on the plan itself. They've said it out loud. I told you already. People are just still not listening.
To tell you again. Back in 2016, the man who now sits in the White House was asked about the national debt. And he said something that got brushed off. He said, "You never have to default because you just print money and that's it." That's the whole strategy in one sentence. Alan Greenspan said the same thing many years before. You just quietly make every dollar worth a little less so the debt shrinks against everything around it.
So in plain English, it is financial repression. It's a word you're going to hear a lot about in 2027. So what does it mean? It sounds a bit technical, doesn't it? That's the intention, so you go, "It's boring, let's move on." When a government keeps interest rates below the inflation rate on purpose, your savings earn you a few percentage points less than it loses value. So every single year the money sitting in your account buys a little less than it did the year before. Same is true for your salary. You are basically being robbed.
You just don't notice it. The robber shows up every day and takes a penny, so it's so gentle. You're like, "Oh, I thought I had an extra penny there or an extra dollar." But you don't notice it. If you run the maths, if they devalue at about 5% a year, you lose roughly half of your purchasing power in just 10 years. Half. The number in your account will stay exactly the same, and 10 years later it buys half of what it does right now. And honestly, to me, that's what it feels like, what has happened the last 10 years.
So America wants a weaker dollar. And I know it's weird to understand for Americans, but it's what they want because a weaker dollar makes American exports cheaper. It makes the debt easier to shrink. But the risk is if you push it too far, the rest of the world loses confidence and starts moving its money out of the dollar. That's the tightrope they're walking.
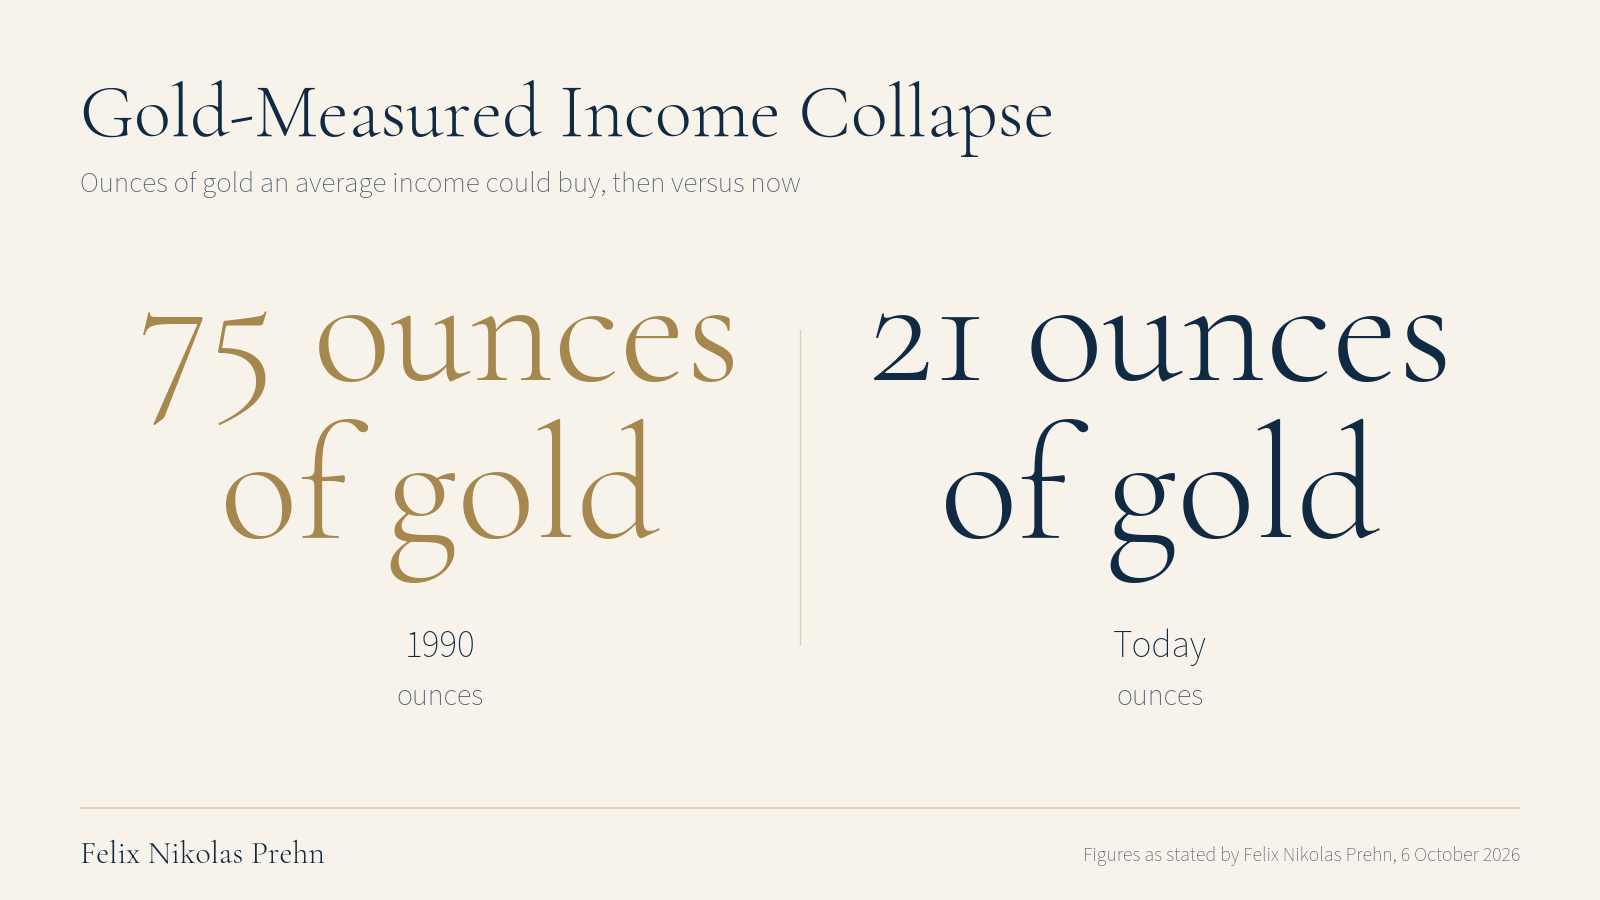
And maybe you're thinking, "Oh, but inflation is only 3, 4% or whatever." Well, forget that number. Forget the inflation number officially. In 1990, an average income could buy 75 ounces of gold. Today, that same average income buys 21 ounces of gold. Same job, same effort, a third of the gold. So measured against real money, the average person is about 70% poorer than they were just a generation ago. It wasn't an accident. It was a plan working as intended.
And it bothers me a lot. So I actually built an index for this. Part of what we do with our economic academic research, because the problem with official inflation numbers is that it's political. It gets adjusted. It gets reweighed. It gets massaged until it tells the story that people want. So we built something that can't be fiddled with and we call it the hours of work index.
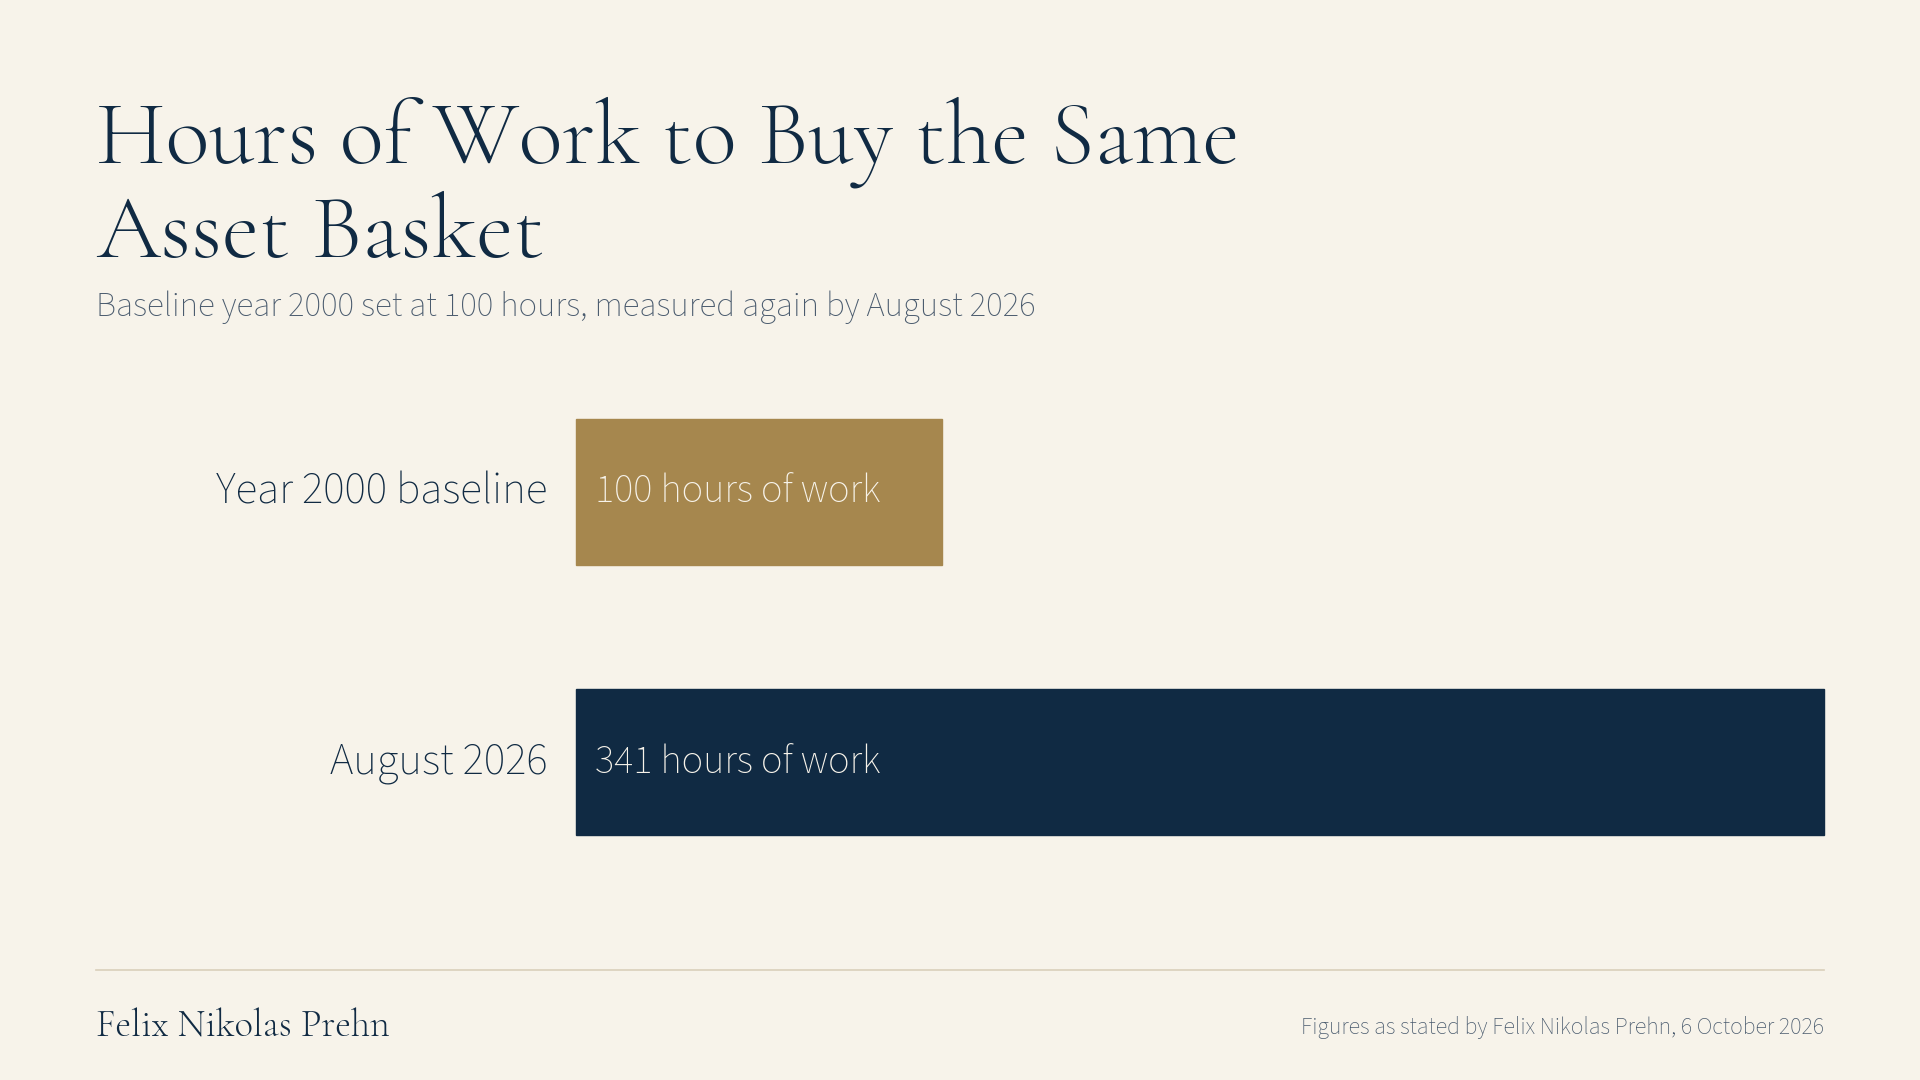
And here it is on the screen. It tells you what an hour of your work does and can buy. So instead of measuring prices in money, we measure them in time of the average worker. How many hours do you have to work to buy the things people can actually save for? And if you take say 2000 as the baseline, they call that 100. By August 2026, that same basket of assets was now 341 hours of work, not 100. The things you work and save for have more than tripled in cost measured in your time in just 26 years. Tripled.
And you don't have to run through all the numbers, but it's not the official inflation story, right? It is the quiet tax everybody who works for a living pays. And now you're thinking, but I'm okay, I'm invested in XYZ, I'll be fine. So I built another tool. I built this just for myself because it is the next part of the problem, which is knowing which part of your portfolio is exposed. And I put it into the Winston Daily app.
And when you log into it, and there's a free trial down below, says zero risk, you can just click on the inflation score and it tells you how heavily exposed you are to inflation right now. Is it at warning level, is it on the well-shielded level? And it then tells you which of your assets are inflation shields and which are not. And it just gives you the facts that most people are missing out on. So go and try it out. It's free for a month. You can cancel on day 29 if you don't like it, so there's zero risk there. I just want to give you guys some information that actually is going to make it better for you to make decisions.
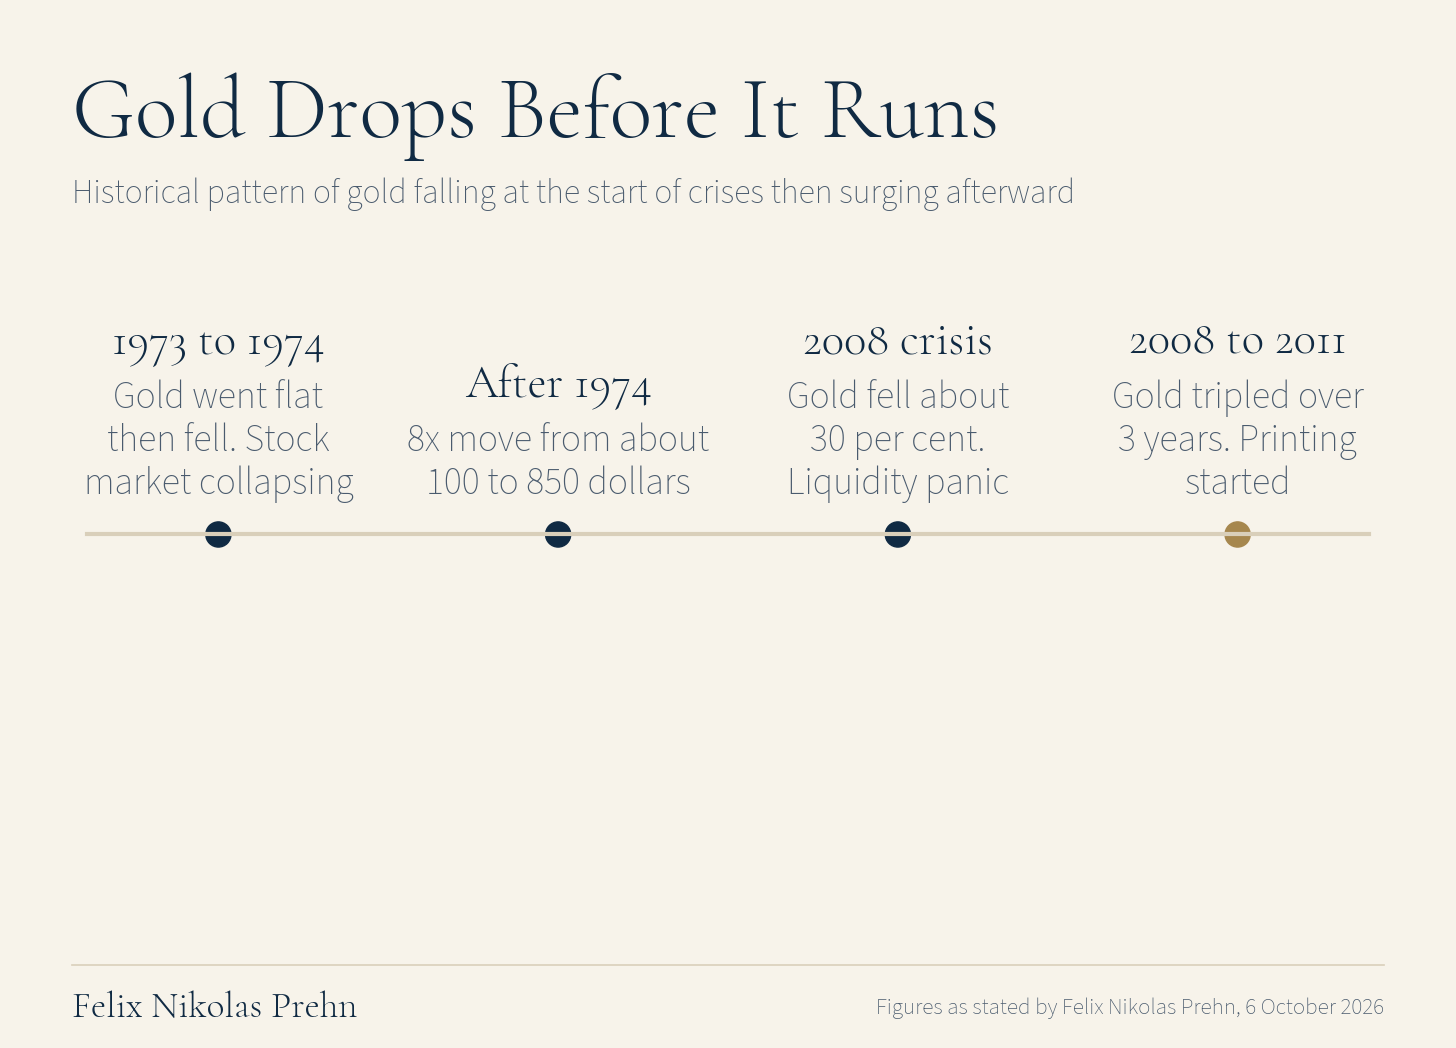
Now, briefly back to gold here because it should tell you why gold dropped this week. Gold falling at the start of a debt crisis isn't a bug, it's actually a feature. It's happened at the start of every major crisis. And then the same thing happens afterwards every single time in history too. Doesn't mean it has to happen in the future, but historic patterns amount.
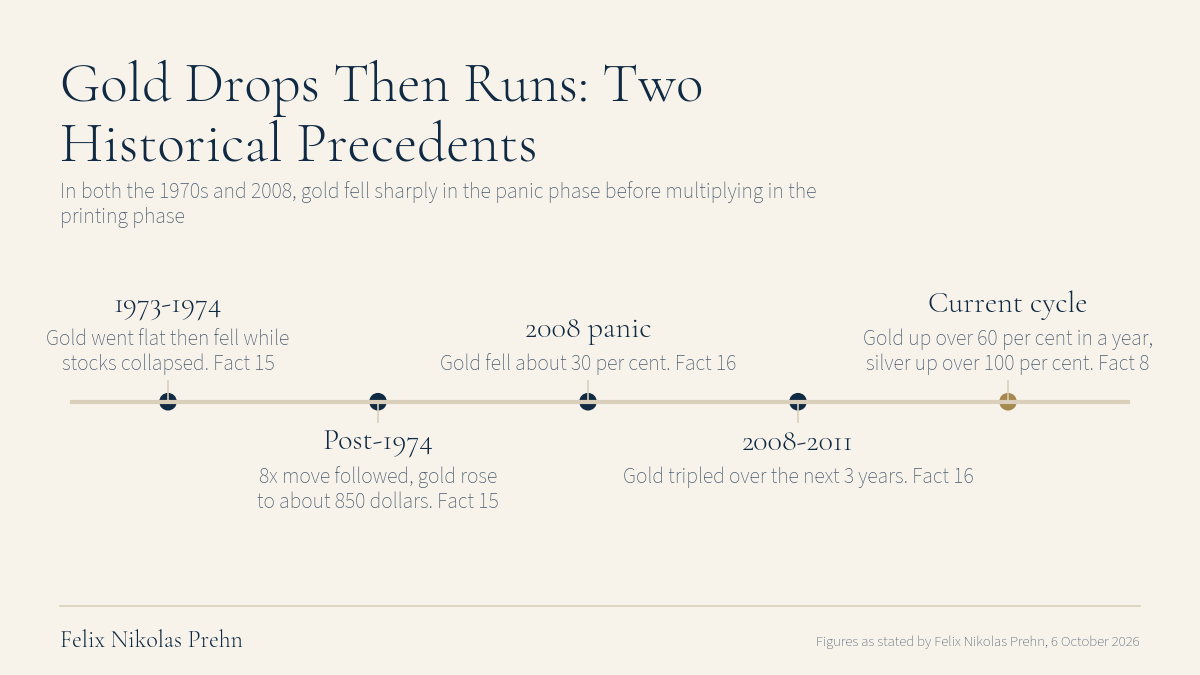
So if you go back to the 70s, the last time inflation ran out of control, most people remember gold going from about $100 to about $850. One of the greatest runs for gold ever. But what they forget is the middle. In 1973 and 1974, while the stock market was collapsing, gold went flat and then gold fell. And the people who sold in that stretch, convinced it had failed them, missed the entire 8x move that followed.
What about in 2008 when the financial crisis hit? Gold didn't shoot straight up. It fell about 30% in a panic and then once the printing started, it tripled over the next 3 years. So why does this keep happening? Because of how a liquidity crisis actually works. When markets break, people in funds need cash now. They need to meet their margin calls and cover their losses. So they sell whatever they can, not what they want to. And gold is one of the most liquid things anybody owns. It's actually easy to sell in a hurry. So it gets dumped first for cash precisely because it is good money.
So the drop isn't gold failing, it's gold being used as the emergency fund, which is what it's intended for. And then the printing starts and then gold reprices against the currency that is suddenly worth less. And that repricing is the move people remember from the 70s, from 2011. And it's the one you forfeit if you bottled out halfway through.
And that brings us back to where we started. Some people are throwing these numbers around, gold at $10,000, $30,000, $50,000, whatever. And it kind of sounds mad, but all it really means is the ratio between paper assets and real money. If they print enough money, those numbers could actually become true. That's not a promise, but I always say gold doesn't go up, it's the dollar that goes down. I know people don't like to hear that, but I think that's actually the truth here.
So what do we do? Well, first, don't panic sell anything because paper prices moved. If you are panicking right now, you probably have too much of a particular investment. This isn't just true for gold or silver, but for anything. So you just want to reduce your exposure to that because you can't sleep. Size your positions in a way that you can live with them, where a 30% move up or down isn't costing you sleep and will make you sell at the worst possible moment.
And then third, look at your whole portfolio through this debt lens, not just your metals. Ask one question. Does this depend on cheap borrowing to survive? Companies drowning in debt, built for this zero interest world we had for the last 20 years, those are in trouble. And again, there's a filter in the Winston app, and it's called Danger Zone. And it'll literally show you the zombies, the German zombies. It'll show you zombies in North America or in the United States, in Canada. Still a lot of zombies in Canada, right? I'm 58 just in Canada. And those are companies who are burning cash and can't service their debt.
People who understood this in the 70s, in the 80s, in the 2000s, they got a lot richer. Everybody else came out poorer. It's not an opinion, it's just historical record. Every cycle without exception. So the question for you is just which one of those do I want to be? That's really all of this. So learn now before it's obvious to everybody. Actually, it won't be obvious to everybody. It'll be obvious to everybody once it's over. That's usually what happens. And even then, most people don't seem to understand it.
So if you put the whole thing together, Japan's bond market is at an all-time high in terms of interest. They're losing control. Europe is cracking and America is paying more interest than it spends on basically everything. Gold's being shaken out on the paper market while the big money is loading up on it and your own hours of work are buying less and less with every month that passes. That is all one planned direction and you can come out of this better or you can come out of this worse and it's literally a choice.
And I know that sounds harsh but it's true. It is a knowledge gap. It is a skill gap. It is an implementation gap. So join me on Saturday live for a live free trading session. I call it the greatest stock market opportunity in 2026. And I'll walk you through the exact playbook. I'll teach you which assets have historically moved first, which moved last, how to position before all of this really plays out. Link is down below in the description. And if you got some value out of this, share it with somebody else who might benefit from it too. Winston's still recovering, and I wish you all the best.
Right now, I think we're going through some sort of weird phase transition. And normally when you get bad economic news.
Or you get bad jobs data that people are going to fly to safety into the bond