
The Strait of Hormuz and why it matters
In Felix's view, roughly 20 million barrels of oil pass through the Strait of Hormuz every day. The volume amounts to about a quarter of all the oil on the planet.
Iran is a major producer. Felix puts its output at 3.3 million barrels per day. Any escalation involving Iran raises the perceived risk to that output, even before a single barrel is lost.
Traders do not wait for confirmed disruption. They price in the possibility of supply cuts.
Demand stays constant. Oil prices rise because the market assigns a probability to future cuts, even when no supply has been lost.
Iran or its proxies, or even drifting sea mines, could interrupt tanker traffic through the Strait. Reports of resurgent attacks on ships in the Strait during late 2026 have kept the perceived risk high.
Oil is an input to transport, manufacturing, shipping, food production, fertilisers, heating and cooling. Higher oil prices raise the cost of all of them.
Higher oil prices raise inflation. Higher inflation pressures the Federal Reserve to keep rates up.
Higher rates increase corporate borrowing costs and reduce profits.
The historical pattern of markets during conflict
Research on S&P 500 performance during conflicts shows a consistent shape. In the first 10 days, the index drops 5 to 7 per cent.
After 35 days, it is flat. After 12 months, it is up 8 to 10 per cent.
Uncertainty depresses prices. Once the scope and scale of a conflict become clear, capital re-enters.
Felix argues that the market cares about pricing and information, not feelings. Once uncertainty falls, capital re-enters and prices adjust upward.
Case studies: Gulf War, Iraq War, Russia-Ukraine
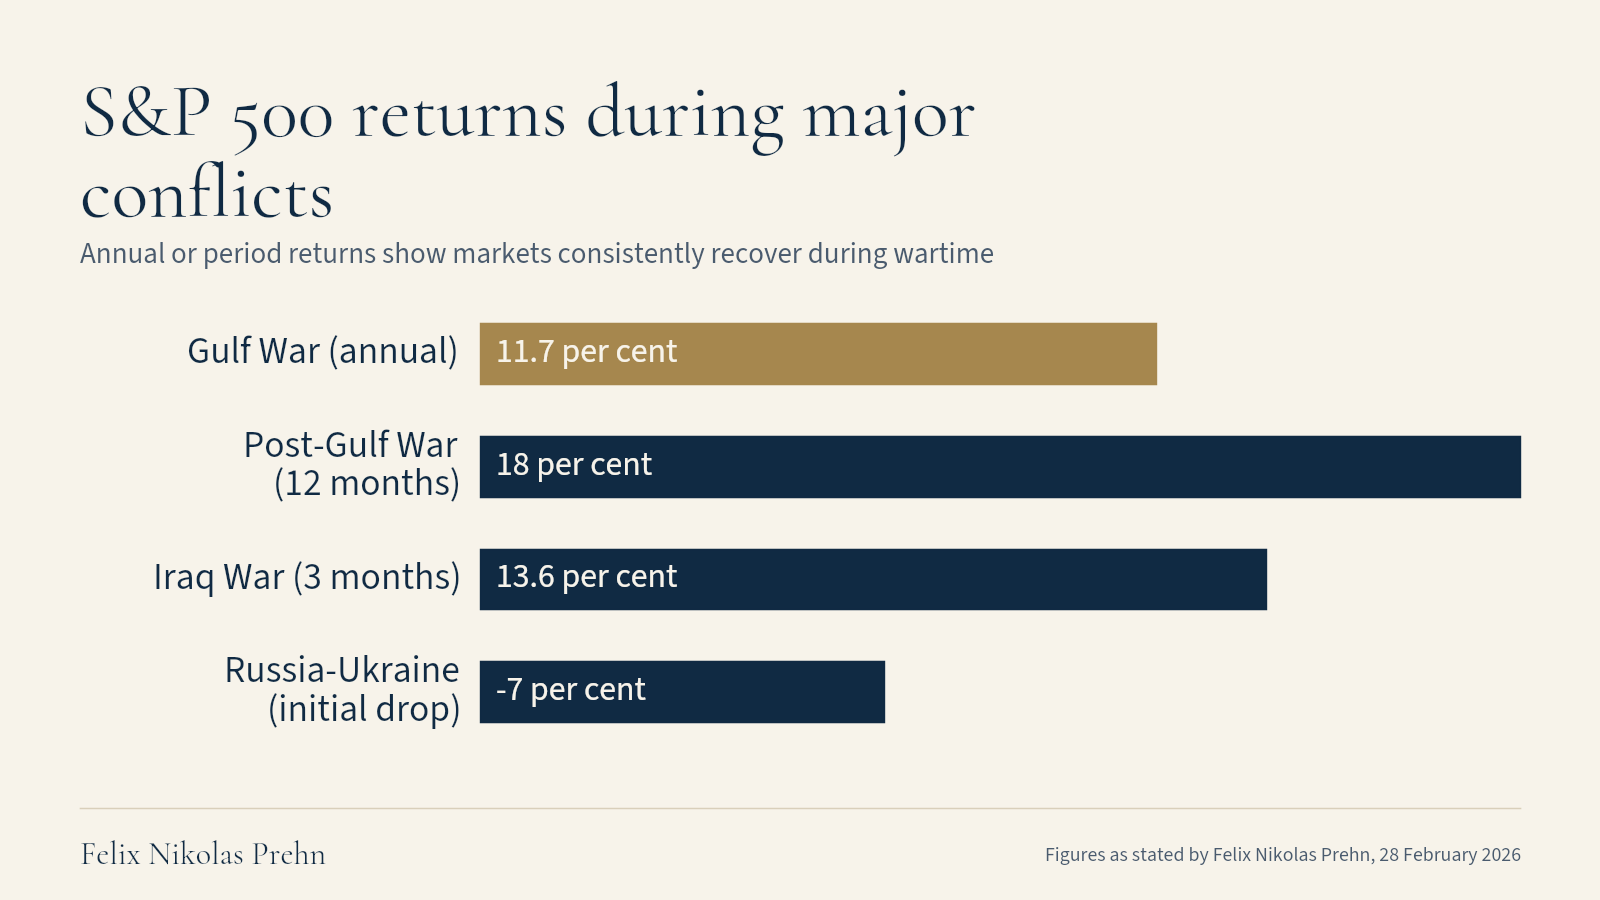
The Gulf War produced an S&P 500 return of 11.7 per cent per year during the conflict. After the war ended, the index delivered 18 per cent in the following 12 months.
The Iraq War began in 2003 and lasted 3 months. The market rose 13.6 per cent over those 3 months.
Felix notes that during the Russia-Ukraine war, the S&P dropped 7 per cent at first and then rebounded above pre-invasion levels within a couple of months. Commodity markets, particularly wheat and diesel, still reflect the conflict. Yet the broad index recovered quickly from the initial shock.
Each conflict differed in geography, duration and severity. In each case the index followed the same shape. A sharp initial drop gave way to stabilisation, then a recovery above the pre-conflict level.
The three phases: shock, repricing, rotation
Markets move through three phases during geopolitical conflict: shock, repricing and rotation.
Phase one, the shock, is fast and driven by fear. Oil prices jump.
Risk assets, including biotech and high-growth stocks, drop as capital moves to perceived safety. Gold prices increase as part of the same flight to safety.
The VIX (a measure of how much crash insurance Wall Street is buying) moves above 20, signalling elevated fear. A VIX below 20 is considered calm. Above 20, the index signals that fear is the dominant force in pricing.
Oil, gold and defence stocks have already spiked by the time phase one is visible. The research shows that purchasing these assets at the moment of maximum panic tends to produce losses. The shock phase can last days or weeks.
Phase two is the repricing period, where panic gives way to calculation. Capital begins to assess whether the disruption is temporary or structural.
The Federal Reserve's likely response to higher inflation becomes the central variable. If oil-driven inflation proves sticky, the Fed may keep rates higher.
The market has already priced in rate cuts, so a delay disappoints expectations and the S&P 500 tends to drop further. Corporate investment, usually financed with borrowed money, becomes more expensive. A single percentage point on a hundred billion dollars of borrowing adds an extra cost of one thousand million dollars.
Extra borrowing costs reduce profits and cash flow.
Phase three is rotation. Money moves between the 147 industries that make up the stock market.
Capital leaves industries damaged by higher rates and enters those that benefit from the new price environment. The rotation phase can last several quarters.
Where the money flows: oil, gold and defence
Bank of America found that, in all geopolitical shocks over the last 90 years, oil was the best-performing asset, up 18 per cent on average. The outperformance fades with time. It disappears 6 months into a conflict.
Gold follows a different path. Bank of America's analysis also found that 6 months after a geopolitical shock, gold continues to outperform by 19 per cent on average.
Oil prices fluctuate after the initial shock. Gold tends to remain at its higher level.
Higher inflation and central banks buying gold with newly created money support the price. Current conditions, with conflict-driven inflation and monetary expansion in several economies, fit the pattern.
Defence stocks have risen sharply. Some names are up 34 per cent since tensions escalated.
The short-term spike reflects the shock phase. The longer-term case rests on procurement cycles.
Defence spending runs on 10-year contracts. The major contractors carry backlogs measured in hundreds of billions of dollars, representing years of revenue already committed.
Inflation may persist if oil is removed from the market. Ships forced to travel around Africa instead of through the Red Sea add further cost. Houthi attacks in the Red Sea have already disrupted shipping routes and raised freight costs, adding to inflationary pressure in the West.
Sectors that suffer and the pricing power advantage
Utilities and real estate suffer during conflict-driven environments with higher rates. Real estate suffers from higher rates for longer. Headlines from late 2026 confirm the Federal Reserve has left its key rate unchanged, with minutes suggesting another hike is likely to combat persistent inflation.
Utilities also fall during these periods. The pattern is consistent in past conflicts, even where the mechanism is not immediately obvious.
Companies with pricing power, those able to pass higher input costs on to their customers, are better positioned during inflationary conflict periods. When oil pushes up the cost of transport, manufacturing and raw materials, a firm that can raise its own prices maintains its margins.
Conflict-driven inflation is difficult for central banks to address. No rate increase brings extra oil out of the Middle East.
Conclusion
The pattern in the Gulf War, the Iraq War, the Russia-Ukraine conflict and the current tensions with Iran is consistent. Uncertainty creates a temporary dip.
The dip ends when the scope of the conflict becomes clear. Capital returns, and the market reprices to reflect new information.
Phase one, the shock, is driven by fear and produces the worst entry points for oil, gold and defence. Phase two, the repricing, is where the Federal Reserve's response and the inflation outlook reshape sector valuations. Phase three, the rotation, is where capital settles into industries that benefit from the changed price environment, and exits those that do not.
The 12-month return of 8 to 10 per cent after a conflict begins has recurred in every major episode studied. Bank of America's data covers 90 years of geopolitical shocks. Oil outperforms early and fades by the 6-month mark, while gold continues to outperform at 19 per cent on average after 6 months.