
A Counterintuitive Pattern
Gold has fallen during every major oil shock in the last 50 years, including 1973, 1979, 1991, 2001 and 2022. The pattern is consistent and counterintuitive.
Oil tankers are under attack in the Persian Gulf. Strikes on shipping in the Strait of Hormuz have reached their highest weekly level since the war began. Gold has dipped in line with the pattern.
Stan Druckenmiller, widely regarded as the greatest macro trader alive, understands the reason. Gold responds to liquidity, the amount of money flowing freely through financial markets, rather than to fear.
In the first weeks of a geopolitical shock, liquidity contracts in a specific and predictable way.
The mechanical sequence behind gold suppression
A major war or geopolitical shock in the Middle East sends oil prices higher.
When oil spikes, consumer prices do not rise immediately. The market's expectation of future inflation jumps at the same time. The Federal Reserve cannot cut rates while inflation expectations are climbing.
When the Fed cannot cut rates, yields (the interest a government bond pays) rise. Government debt paying 5 per cent with near-zero risk becomes more attractive than gold, which pays no income at all. Money flows out of gold and into bonds.
Frightened capital from around the world moves into US government debt as a safe haven. The dollar strengthens as a consequence.
A stronger dollar combined with higher interest rates gives foreign buyers a double benefit: they earn more income and their currency position appreciates. Gold, denominated in dollars, loses value from the exchange-rate shift alone.
Higher bond yields, a stronger dollar and a frozen Fed rate all weigh on gold at the same time. The drag on gold lifts only when the Fed is forced to cut.
The US debt trap that forces reversal
The US national debt is roughly 38 trillion dollars. About 9 of those 38 need to be refinanced, meaning old borrowing replaced at today's rate. The cost of rolling over that debt at current rates adds roughly 1,000 billion dollars a year in interest.
The US government already pays more in interest on its debt than it spends on its entire military budget.
The arithmetic is visible to anyone trading government bonds. The only way the debt burden remains sustainable is if interest rates come down. The bond market therefore prices in the expectation that the Fed has to cut rates, because the United States cannot afford not to.
When the bond market internalises that rates must fall, the dollar weakens. Bond yields decline. Gold resumes its rise, as it has after every prior oil shock.
Historical proof: 50 years of oil shocks and gold recoveries
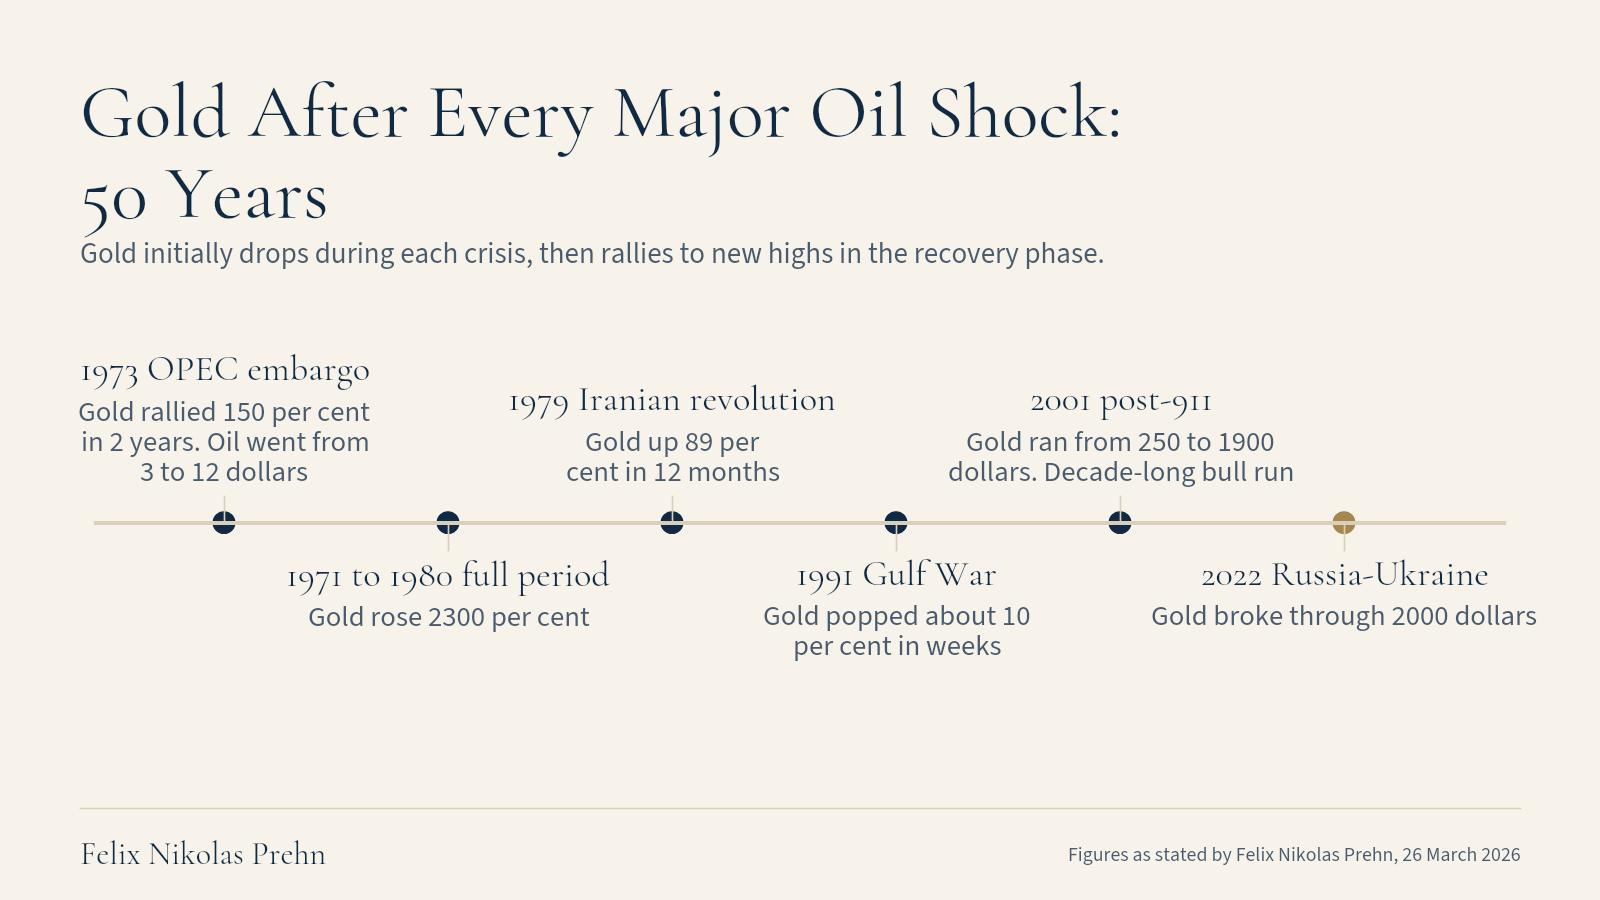
In October 1973, OPEC cut oil production and embargoed the United States. Oil rose from 3 dollars to 12 dollars, a 4x increase.
Gold initially dropped, then rallied 150 per cent in 2 years. From 1971 to 1980, gold rose 2,300 per cent.
In 1979, the Iranian revolution disrupted Persian oil production. Gold rose 89 per cent over the following 12 months.
The 1991 Gulf War pushed gold up about 10 per cent in a couple of weeks. Gold still rose, though the move lasted weeks rather than years.
After 2001, gold began a decade-long bull run from 250 dollars to 1,900 dollars.
In 2022, gold broke through 2,000 dollars following the Russia-Ukraine conflict. In every case, gold fell first and rallied once the Fed loosened monetary conditions.
Every major market crash was preceded by an oil price spike. The conflict between Iran, Israel and the United States that has unfolded since mid-2026 provides the current context for that observation.
Central banks and silver: the structural setup today
Central banks bought over 1,000 tons of gold last year. Central banks are diversifying away from the US dollar because they know the Americans can seize their reserves.
Silver has been in a supply deficit for 3 years running as of 2026. The world consumes more silver than it produces.
COMEX silver industry inventory has fallen from roughly 120 to about 76 million ounces. In Felix's view, the largest refiner of silver has restricted exports. Headlines from late 2026 indicate that China will continue suspending export quota management for silver.
When institutional positioning against gold has reached extreme levels, the price has historically risen 20 per cent over the following 90 days.
Felix argues the structural setup is more extreme than in any prior oil crisis.
Government debt is larger than in any prior crisis. Central bank gold purchases have accelerated.
COMEX silver inventory has dropped from 120 to 76 million ounces.
Miners, defence and utilities
When gold rises 10 per cent, miners tend to go up 20 to 30 per cent. Miners amplify the move in the gold price without the complexity of borrowing to increase exposure.
20 per cent of the world's oil passes through the Strait of Hormuz. The route is currently disrupted, with attacks on oil tankers reaching their highest weekly level since the war began. Oil prices are rising because 20 per cent of the world's oil passes through that strait.
After 911, defence stocks outperformed the S&P by 47 per cent. The conflict between Iran, Israel and the United States provides a comparable backdrop.
In 2022, the S&P fell 15 per cent after Russia invaded Ukraine. Utilities were flat over the same period. The sector pays dividends and serves domestic markets, which makes it defensive.
The sequence and its reversal
An oil shock raises inflation expectations, bond yields and the dollar. Together these 3 forces suppress the gold price temporarily. The same pattern has appeared in every major oil crisis since 1973.
The reversal begins when the scale of US government debt forces the Federal Reserve to cut interest rates. Once rates fall, the dollar weakens. Bond yields decline and gold resumes its climb, as it did after each of the 5 shocks recorded since 1973.