
Oil at 115 dollars and the 50-year pattern
Oil hit 115 dollars a barrel in the paper market.
The Federal Reserve modelled 3 scenarios for the crisis. The mild case assumed 98 dollars, the base 115 dollars, and the severe outcome 130 dollars leading to a major global recession.
The paper price is at the base case. The physical price has moved well beyond it.
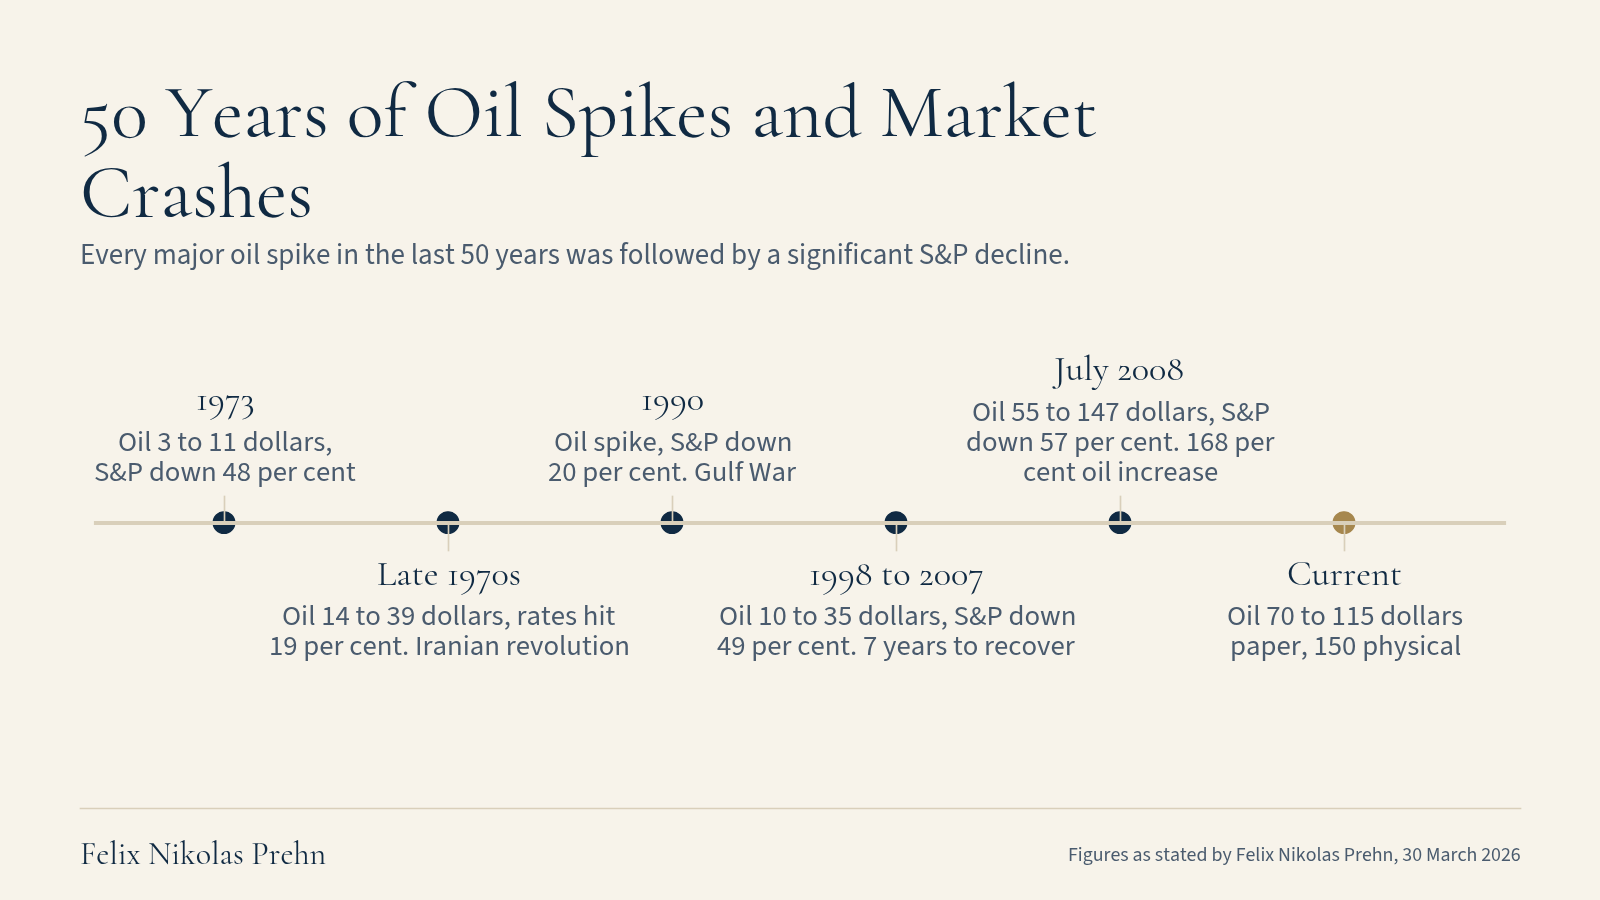
Every single time oil has spiked in the last 50 years, a market crash followed. The pattern held in 1973, 1979, 1990 and 2008.
In 1973 oil went from 3 dollars to 11 dollars. The S&P dropped 48 per cent.
The Iranian revolution at the end of the 1970s sent oil from 14 to 39 dollars. Inflation reached extreme levels. Interest rates went to 19 per cent.
In the 1990 Gulf War, oil spiked and the S&P dropped 20 per cent. From 1998, oil tripled from 10 to 35 dollars. The S&P fell 49 per cent over 2 years and took 7 years to recover until 2007.
Oil went from 55 dollars to 147 dollars in July 2008, a 168 per cent increase, just before the global financial crisis. The S&P fell about 57 per cent.
The Russia-Ukraine conflict produced an oil rally and only a 7 per cent S&P decline which recovered quickly. Felix argues the earlier episode was a geopolitical event rather than a structural supply shock.
The current situation looks more structural. Damage to oil and gas facilities and countries like Iraq stopping pumping because storage is full cannot be reversed quickly. Even if the conflict stopped tomorrow, supply would take a long time to restore.
The physical oil divergence
In Felix's view, oil flowing through the Strait of Hormuz is down 70 per cent, losing about 5 million barrels a day. Reports from the region remain contradictory, with some sources suggesting flows have partially resumed while others describe worsening disruption.
The paper price of oil trades at 113 dollars. As Felix puts it, the price for actual physical oil being delivered to Asia is 150 dollars plus. When the cost of actual delivery diverges from the paper price, it signals real scarcity far worse than financial markets are reflecting.
The Federal Reserve's severe scenario assumed 130 dollars. Physical delivery prices have already passed that threshold.
The domino chain from oil to consumer
Transportation and energy costs rise first. Ships, trucks, planes all run on fuel priced off crude.
Diesel has gone from 3 dollars 50 to 5 dollars 50 a gallon. Everything made and moved in America is more expensive as a result.
Producer costs follow. Oil is an input for plastics, chemicals, fertilisers, packaging and manufacturing.
Production costs pass through to consumer prices. US inflation readings for the year are already at 4 per cent plus. Goldman Sachs raised its inflation forecast to 3 per cent.
The Fed is trapped
The market is pricing in a 50 per cent chance of a rate hike. Expectations have moved from 4 cuts to a possible hike.
In Felix's view, the new Fed chair Kevin Walsh held rates and revised the dot plot to only 1 cut from 2026, down from 2.
The trap is stagflation: inflation and a stagnating economy arriving together. The Fed cannot cut because cheaper borrowing would worsen inflation.
If it hikes rates, the economy crumbles even faster. The combination removes the central bank's main tool for responding to a downturn.
Felix argues the Fed cannot lower interest rates because doing so would trigger inflation. The government can provide fiscal support, but all of that means the dollar loses more strength.
Why safe havens are failing
Gold is down roughly 20 per cent. Silver is down 44 per cent.
In a conventional crisis, gold would be expected to rise. The current sell-off has a different mechanism.
As Felix puts it, Walsh is an inflation hawk. Higher rates raise the opportunity cost of holding gold, a non-yielding asset, because bonds suddenly offer more attractive interest.
The dollar has strengthened, which mechanically pushes dollar-denominated gold lower. CME Comex margin calls have forced liquidation.
Tech stocks tumbling at the same time has created panic selling into cash, the one asset perceived as even safer than gold.
The result is a broad sell-off where traditional hedges fail alongside risk assets. Rate expectations and dollar strength pushed gold lower, even as the underlying supply disruption deepened.
Consumer discretionary and the contrarian case
Consumer discretionary stocks are trading at levels not seen since the global financial crisis and the pandemic. Household sentiment has fallen to near record lows, driven by frustration over high costs.
More than half of the stocks in the S&P consumer discretionary index are trading at least 20 per cent below their last year's highs. At these levels the sector has returned 14 per cent over the next year, a pattern that has occurred 23 out of 28 times.
Software firms are also heavily oversold.
Consumer finance companies, which would benefit from any future reduction in interest rates, have also been sold down heavily.
Bank of America sent a research note to institutional clients detailing where large holders are positioning during the crisis.
Bank of America sees a policy panic bailing out the market. Once the S&P drops below certain trigger levels, governments and central banks will intervene.
If that policy panic arrives, the dollar weakens.
A weaker dollar is mechanically positive for gold and for international stocks. Felix argues that gold and foreign stocks will regain leadership as the dollar folds.
The current gold sell-off, in his view, may prove to have been a buying opportunity.
The US stock market's premium valuation depends on the perception that American leadership can control outcomes.
If the Iran crisis shows the United States cannot resolve a major energy disruption quickly, that perception erodes. In that scenario the dollar loses value and gold and international stocks become the leaders.
A prolonged conflict reduces the ability to nudge markets and to attract foreign capital.
What the data says about timing
10 days into a geopolitical shock, the S&P is usually down 5 to 7 per cent. 12 months later, it has tended to be higher.
Oil rallies always fade within about 6 months of a spike.
Gold has returned about 19 per cent on average 6 months after a shock.
The tariff disputes and the Ukraine conflict did not produce a long-term impact on inflation or energy prices.
Felix argues the current crisis looks more structural. Tariffs and the Ukraine conflict had no lasting impact on inflation or energy costs.
The current disruption has already fed through to inflation and energy costs. The damage to infrastructure and the halt in production from countries like Iraq cannot be reversed quickly.
Oil rallies tend to fade and markets recover over a 12-month horizon. A structural supply shock may not follow the same pattern. If a policy panic intervention materialises, the dollar weakens and gold regains ground. If the Iran conflict damages the perception of US control, leadership shifts away from US stocks.