
The End of a 45 Year Bear Market
Commodities fell for 45 years. From 1980 until very recently, metals, oil and agricultural products declined while stocks and property rose.
The 45 year bear market shaped expectations. It also suppressed interest in the asset class.
Commodity bull markets can last 15, 20 or 30 years. The previous decline was long enough that few working professionals have experienced a sustained advance in hard assets. Silver and gold remained at the bottom of the cycle for decades.
A reversal of that length is not visible in a single quarter of price gains. It builds slowly, then accelerates as supply constraints meet rising demand. The commodity cycle runs over decades.
Currency Debasement and the Eightfold Dollar Expansion
The quantity of US dollars in circulation has increased about eightfold over the last 20 years. I argue the expansion makes each dollar worth less. The effect supports prices for hard assets such as silver and gold.
The Federal Reserve purchased 18 billion dollars in Treasury securities in a single recent week. At the height of 2006, the comparable weekly amount was 11 billion dollars. The Fed's recent weekly acquisition was roughly 64 per cent larger, and it occurred outside any declared crisis.
Central bank balance sheet operations remain a subject of technical debate. I argue the Federal Reserve is printing money again. The effect erodes the purchasing power of cash.
Money printing at 8 to 9 per cent a year erodes purchasing power. Markets rising almost 20 per cent a year compound the loss.
Deflation is fairly unlikely given how much money central banks are printing, in my view. Hard assets priced in a depreciating currency tend to rise in nominal terms. Silver and gold are two such assets.
De-dollarisation and Central Bank Gold Accumulation
BRICS nations have launched a pilot for a gold anchored currency called the unit. I argue the bloc is building alternatives to the dollar.
The pilot remains at an early stage. A credible dollar alternative is hard to build.
Central banks bought almost 900 tons of gold last year. The total is double the usual average. 90 per cent of central banks expect their gold reserves to keep rising.
Gold purchases at that scale mark a shift in reserve management. Silver, which trades alongside gold, benefits from the same reallocation.
The Physical Silver Shortage
The silver market is heading into its 6th consecutive year of supply deficit. The cumulative gap has reached 800 million ounces, nearly an entire year of mining production.
The world has consumed more silver than it has produced for 6 years running. The difference has come from inventories built up over prior decades.
COMEX silver inventory has fallen from 120 to 88 million ounces since the previous March. The decline is 30 per cent, and warehouse and vault inventories show a similar pattern elsewhere.
US warehouse silver inventory is down 70 per cent since 2020. London vaults have lost about 40 per cent of their holdings. Shanghai inventories are at a decade low.
About 70 per cent of silver is produced as a byproduct of mining copper, zinc and lead. Miners cannot simply increase silver output in response to higher prices.
A miner would need to extract more copper, zinc and lead to raise silver output, and may not want the base metals. Even if silver prices doubled or tripled, supply would not respond quickly.
Building a new mine takes 8 to 12 years from discovery to production. The years go to permitting, feasibility studies and construction.
Ore grades are declining, and miners extract less silver per ton of rock than before. A lot of the accessible metal has been found.
China Removes 70 Per Cent of Refined Supply
China controls 60 to 70 per cent of the world's refined silver supply. In my view, China implemented export restrictions on refined silver at the beginning of the year.
Beijing classified it as a strategic material alongside rare earths. A special government licence is required to export it.
Beijing wants to keep the metal at home, for its own solar panels, electric vehicles and electronics.
The removal of 60 to 70 per cent of global refined output from international markets creates a shock to physical availability. Headlines on the precise scope of the restrictions remain mixed.
Some reports indicate China will continue suspending export quota management for silver to ease trade. My claim rests on the strategic classification.
If my reading is correct, a market already running a 6 year deficit would see the majority of its refined supply removed. Inventories in decline would drain faster still.
Industrial Demand That Cannot Be Switched Off
Solar panels require about 25 per cent of annual global silver supply. Electric vehicles use about 2 ounces of silver each, 60 to 70 per cent more than a traditional combustion vehicle.
Silver demand is inelastic, meaning it does not decline much when prices rise. Industrial users continue to manufacture solar panels and cars even as the silver price increases.
Silver ETFs (exchange traded funds that buy and store physical metal in vaults) consumed about 134 million ounces last year. As ETF holders tend to maintain their positions for long periods, the metal is effectively removed from circulating supply.
On COMEX, there are about 365 paper contracts for every 1 physical ounce of silver. Each contract gives the holder the right to demand delivery of real metal.
When inventories are falling and claims are 365 times the available metal, the gap between contractual and physical markets widens. If enough holders demand delivery, the exchange faces a problem it cannot solve with more contracts.
Price can curb demand, but only slowly. If prices stay very high for a very long period, industrial demand will decline.
Users will find alternatives when the cost becomes painful enough. Solar and EV adoption continues to pull silver out of the market.
The Path to 500 Dollar Silver and Mining Stock Returns
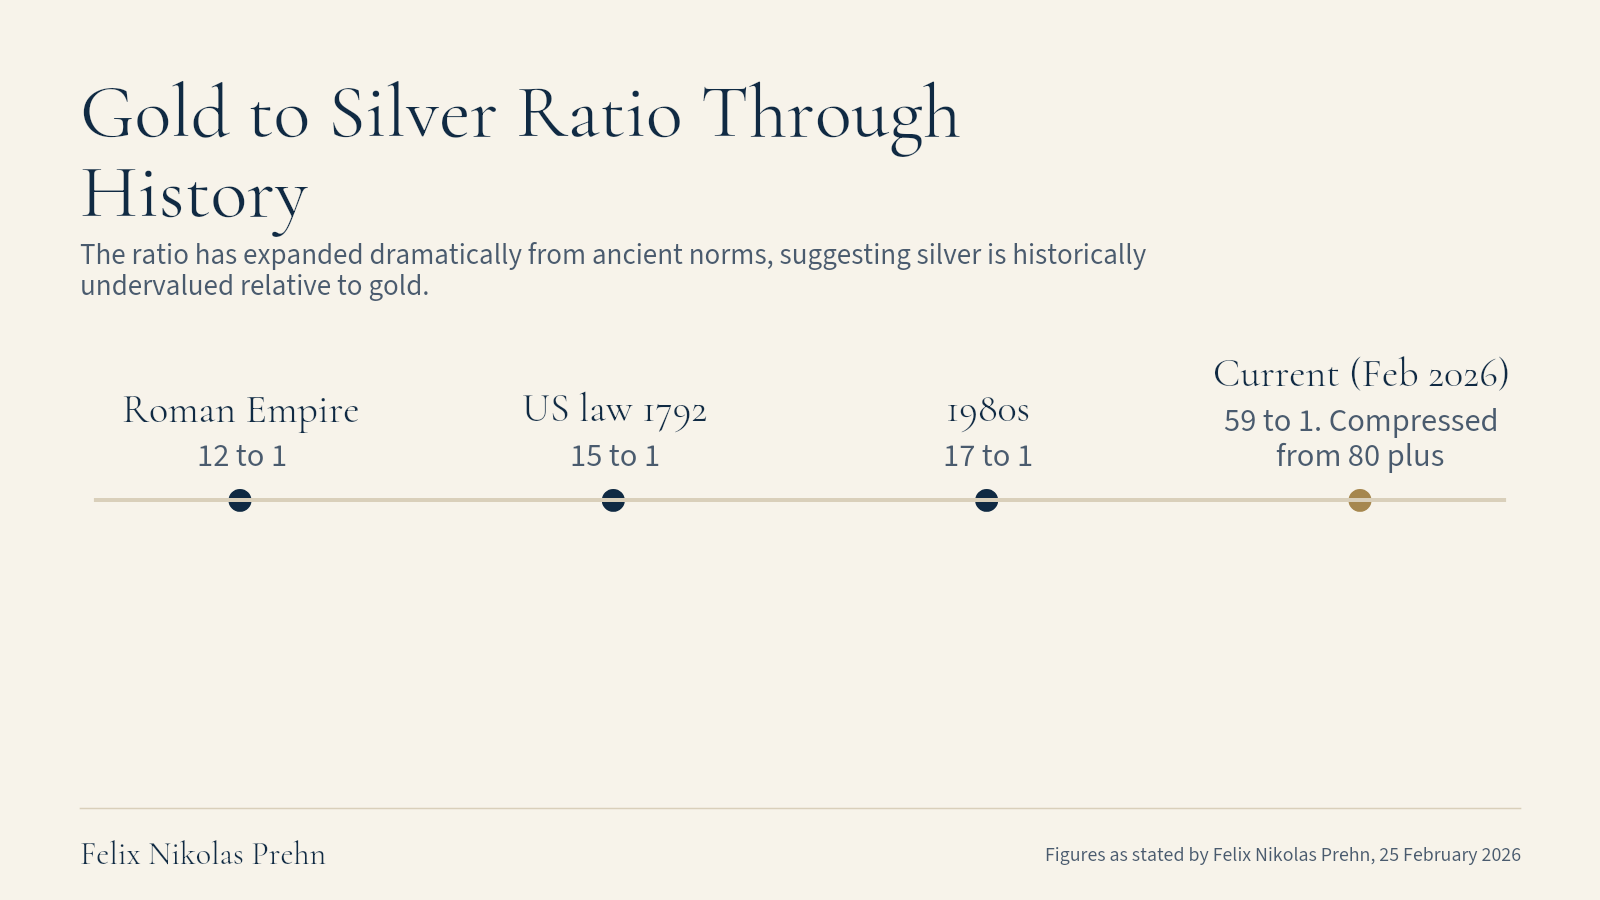
The ratio between the two metals measures how many ounces of silver it takes to buy 1 ounce of gold. At the time of recording, the ratio stood at about 59 to 60.
In the Roman Empire, it was 12 to 1. US law set it at 15 to 1 in 1792. In the 1980s, it reached 17 to 1.
The arithmetic starts with gold and the ratio between the two metals. At a gold price of 5,000 dollars and a 30 to 1 ratio, silver reaches 167 dollars.
At 15 to 1, the level set by US law, silver rises to 333 dollars. At 10 to 1, the price climbs to 500 dollars.
Gold does not need to stay at 5,000 dollars for silver to reach 500. At a gold price of 6,000 dollars, a 12 to 1 ratio would bring silver to 500 dollars.
Miners amplify the move in the underlying metal. Major gold and silver producers such as Newmont and Barrick are trading at price to earnings ratios of 11 to 13. The valuations are comparable to 2016 bottom of market levels.
Junior mining stocks delivered returns of thousands of per cent in the 1979 to 1980 silver mania. The worst performer in that group returned 233 per cent. Miners at current valuations remain at 2016 levels, even as margins have expanded.
The commodity supercycle appears to have turned after a 45 year bear market. The US dollar supply has expanded eightfold. Central bank gold buying has doubled its usual average, and silver has run a supply deficit for 6 consecutive years.
A doubling or tripling of the silver price would not close the deficit quickly. 70 per cent of output is a byproduct of other mining, and new mines take a decade to build. Ore grades are declining, so each ton of rock yields less metal than before.
Industrial demand from solar and EV production does not decline much when prices rise. China, which controls 60 to 70 per cent of global refined silver, has restricted exports of the metal, as I argue. Newmont and Barrick trade at price to earnings ratios of 11 to 13, comparable to 2016 trough valuations.