
Oil prices near 100 dollars, falling employment in housing and high investor pessimism dominate the economic headlines of late 2026. The mechanics behind each headline point in a different direction.
Oil production and domestic revenue
Oil is up almost 50 per cent in a year.
Brent crude rose from about 60 dollars to a spike of 116 dollars and was just under 100 dollars at the end of September 2026.
The reflexive reading is that expensive oil squeezes consumers and drags the economy down. For decades, high prices did squeeze American growth. The 1970s oil shock wrecked the economy for the best part of a decade.
High oil prices functioned as a tax America paid to the Middle East, with money flowing out of petrol stations in the heartland and landing in Riyadh.
Production figures change the arithmetic.
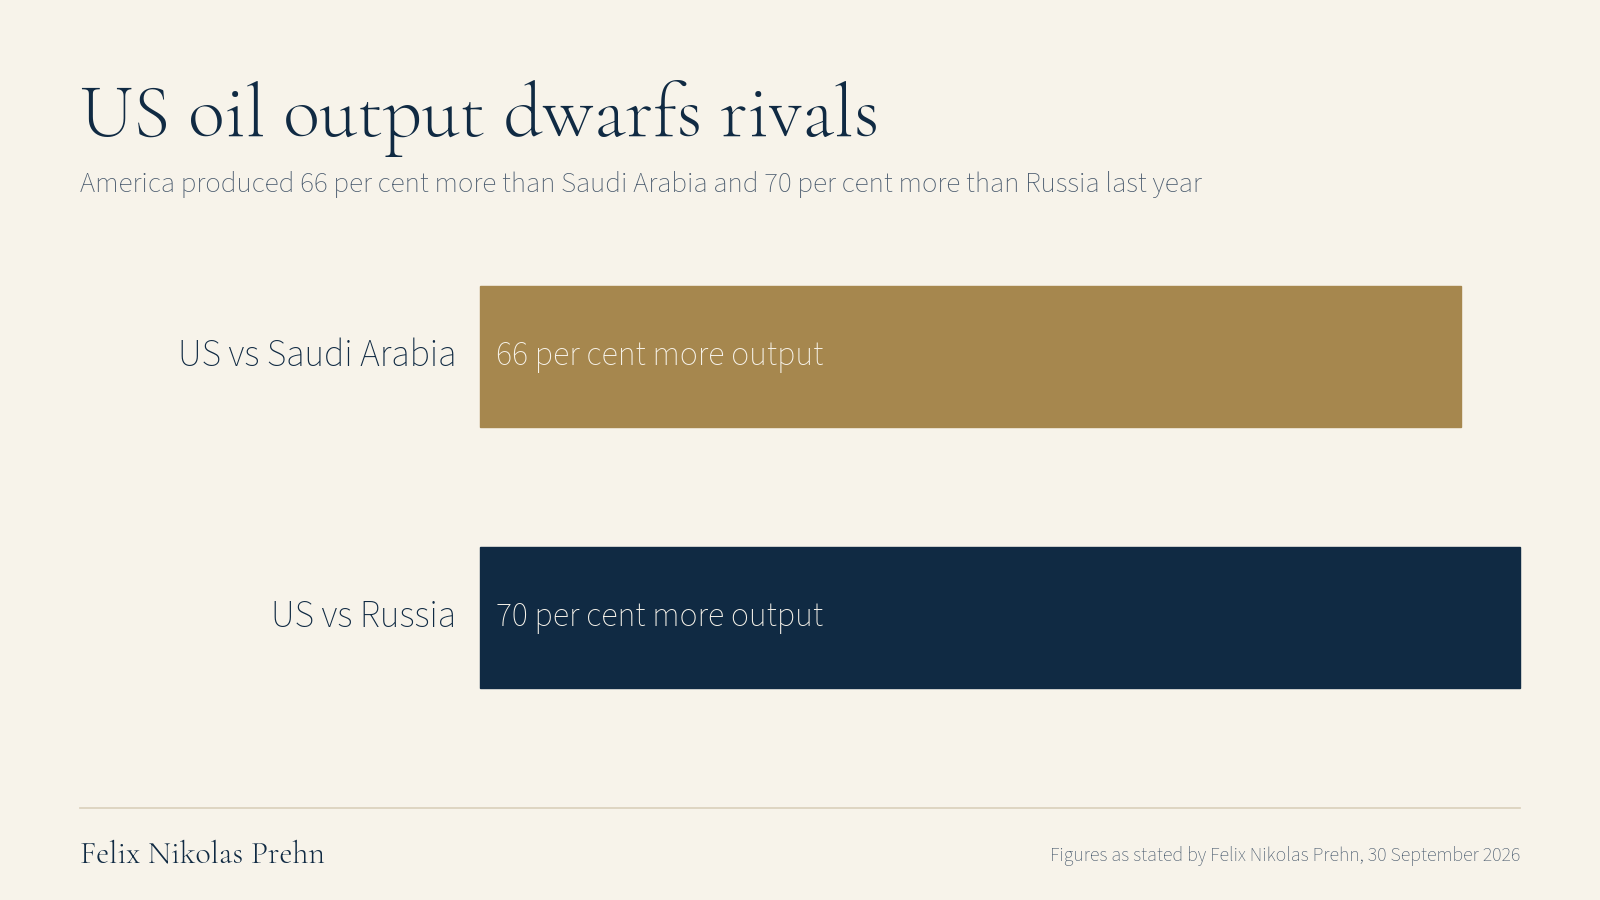
In Felix's view, America is by far the biggest oil producer on the planet. It produced about 66 per cent more than Saudi Arabia last year and 70 per cent more than Russia.
America is producing almost 3 times the oil it extracted in 2008.
When the price rises, a large chunk of that money now lands in America.
Oil revenue lands in Texas, Dakota and New Mexico. It lands in pension funds that own the drillers and in the pockets of oil company shareholders and the whole supply chain.
High oil revenue recirculates inside the domestic economy rather than leaving it.
S&P 500 market concentration
The S&P 500 is up about 13 per cent this year on the surface. Only about 18 per cent of names are up.
A handful of stocks carry the entire index.
The remaining constituents drag performance lower. 4 out of every 5 stocks in the index lost ground this year.
The concentration risk is real and well documented in recent months, with analysts noting that the rally depends on a very narrow group of companies.
Housing cracks and the Fed's cover
Real estate job openings fell from about 95,000 in July to about 50,000 in August, roughly halving to the lowest level since 2024.
Mortgage rates are above 7 per cent. New buyers cannot afford mortgages at that rate.
Estate agents get paid when they sell something, so they stop hiring or start letting people go.
Housing is the most rate sensitive sector in the whole economy.
Felix argues that the sector is where economic data breaks first.
When housing activity declines, builders cut back. Furniture shops, removal companies, carpet fitters and mortgage lenders all lose business in turn.
The Federal Reserve cares about prices and jobs.
For a long while the argument against cutting rates has rested on solid growth and high prices.
Real estate job figures like these appear in the briefing materials when the Fed makes interest rate decisions. The decline gives the Fed cover to ease. Officials can point to slowing housing and fewer job openings in the sector as reason to ease off.
The September data does not guarantee a cut. It does weaken the case for further tightening.
When rates come down, borrowing is cheaper for companies and their profits rise.
Trillions of dollars remain parked in money market funds, earning a decent return at current rates.
Lower rates shrink that return. Capital in those funds then migrates toward higher-yielding assets.
Share Prices and Economic Output
Share prices and economic output do not move in lockstep.
In April 2020, American unemployment hit 14.7 per cent.
The S&P 500 reached a record high in August of that same year.
The government and the Fed flooded the system with money. A lot of it went into stocks.
In 2022, the S&P fell 19 per cent over the year while jobs were plentiful. The Fed was raising rates and withdrawing money from the system.
Felix argues that bad economic data can be a bullish signal for the stock market.
Weak jobs and a slowing housing market give central bankers a reason to ease policy. When policy eases, capital flows into the market before the real economy registers any change.
Investor sentiment as a contrarian indicator
The American Association of Individual Investors has run its sentiment survey since 1987. On average, 31 per cent of respondents say the market will be lower in 6 months. Currently, 48 per cent say the market will be lower in 6 months.
Two prior episodes of extreme pessimism preceded large gains.
In 2009, 70 per cent of Americans were bearish. The S&P moved up 67 per cent in the next 12 months.
In 2022, 60 per cent of Americans were bearish. The stock market moved up 18 per cent that year.
When someone is very bearish, they have in most cases already sold.
Few sellers remain. A large amount of cash stays on the sidelines, available to re-enter the market.
Sentiment data from September 2026 has fluctuated within the month, with some readings pulling back from the most pessimistic levels. The current 48 per cent figure is lower than the 60 per cent of 2022 and the 70 per cent of 2009.
Money supply is accelerating
US M2 (all the cash, deposits, savings and money market funds that can be spent or withdrawn quickly) is currently 23 trillion dollars.
It grew at the fastest rate since 2022.
Last year at the same point, 600 billion dollars in new money was created. In 2026 the figure was almost a trillion dollars.
From 2020 to 2021, the money supply went up 27 per cent.
The S&P doubled in about 17 months. Asset prices rose in every category.
The current pace of money creation is slower than the 2020 to 2021 surge, and the effect is narrower. 82 per cent of stocks are down even as the money supply expands.
New capital flows into a narrow set of stocks. The 82 per cent decline rate confirms the pattern.
Felix argues that newly created money has to go somewhere. Capital migrates toward a return and tends to end up in stocks.
In 2026, the beneficiaries are a narrow group.
The picture in aggregate
High oil prices no longer hurt the American economy the way they did in the 1970s. America is the largest producer.
The revenue stays inside the country.
Real estate job openings halved from about 95,000 to about 50,000 in a single month. The weakness gives the Fed a reason to loosen policy.
Looser policy then pushes capital into financial assets.
Bearish sentiment stands at 48 per cent. In 2009, 70 per cent expected a decline, and the S&P rose 67 per cent over the next 12 months.
In 2022, 60 per cent were pessimistic, and the stock market rose 18 per cent. The cash raised from those sales remains on the sidelines.
M2 expanded before the S&P moved in 2020 and contracted before it fell in 2022.
In 2020, the Fed and the government flooded the system; the S&P doubled in 17 months while unemployment was 14.7 per cent. In 2022, the Fed raised rates and pulled money out; the index fell 19 per cent despite plentiful jobs.
M2 grew by almost a trillion dollars this year, up from 600 billion at the same point last year, and is expanding at the fastest rate since 2022.
Felix argues that newly created money migrates toward a return and tends to end up in stocks. Capital flow determined the outcome in 2020 and in 2022.
M2 growth is accelerating in 2026. The money is flowing into a narrow group of stocks rather than the broad index.