
The worst week in 43 years
Gold suffered its worst weekly collapse since 1983. The paper market fell 9.4 per cent in a single week.
Silver dropped 17 per cent in one session. Gold fell 8 per cent on the same day. An earlier drop of 7 per cent had already occurred in March.
Independent confirmation of the 1983 comparison remains limited. The sell-off was concentrated in paper contracts and amplified ETF products.
The rally that preceded the crash
The crash followed a rally of unusual speed. Gold rose 55 per cent in 2025. Silver rose over 130 per cent.
Over 70 billion dollars flowed into gold ETFs throughout 2025 and 2026. Much of that capital went into 2x or 3x amplified products.
All of them rebalance daily, adjusting their exposure at the close of every session. The instruments magnify moves in each direction.
The domino chain from war to oil to inflation
The chain began with disruption to the Strait of Hormuz.
Military strikes hit Iran. Iran retaliated. Tanker traffic through the strait stopped, cutting off 20 per cent of global oil supply.
Goldman Sachs predicts oil could reach 180 dollars. At prices above 100 dollars, the costs of gas, food, fertiliser, plastics and pharmaceuticals all rise, because each depends on oil as an input.
The oil shock trapped the Federal Reserve. The resulting inflation problem meant rate cuts were not happening.
The European Central Bank also moved to raise interest rates. Higher rates pushed bond yields up and strengthened the dollar. Holders of other currencies bought dollars to capture the interest on US government bonds.
Hedge fund algorithms trade on preset rules. They responded to 2 inputs: rising bond rates and a stronger dollar. They dumped billions in paper gold automatically, allowing the inflation signal to override the safe haven impulse.
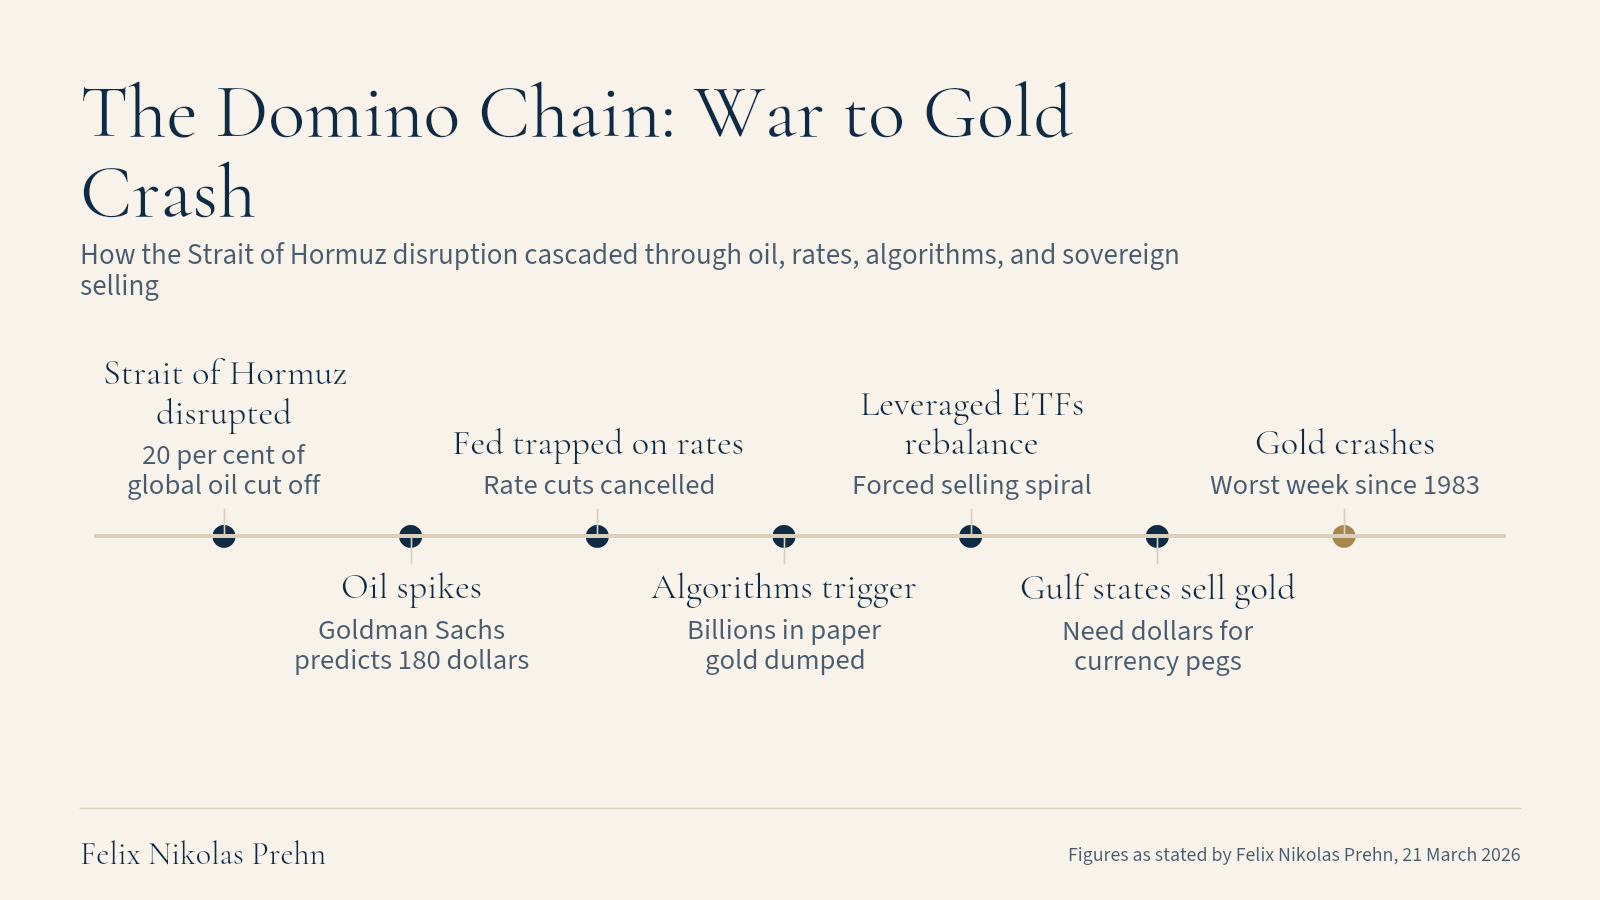
The chain thus ran from war through oil disruption to inflation, which forced rates higher. As bond yields and the dollar rose together, algorithmic selling followed, causing gold to fall instead of rallying on the conflict.
The leveraged ETF death spiral
Over 70 billion dollars poured into gold ETFs throughout 2025 and 2026. Much of that inflow went into leveraged 2x or 3x products that rebalance daily.
The rebalancing creates forced selling spirals when prices decline. When gold falls, the amplified ETF must sell to rebalance.
Lower prices trigger margin calls, which in turn force more selling by the ETF.
The cycle repeats until the forced selling exhausts itself or the price stabilises.
Buyers of amplified gold ETFs were adding exposure while institutions were selling. The divergence between the two groups is visible in flow data.
The 1983 parallel and Gulf state sovereign selling
In February 1983, a Middle Eastern oil producing country sold gold to raise cash. New supply had come from the North Sea, Alaska, Brazil, Egypt, India and Malaysia, and the country's oil market share collapsed as OPEC's dominance eroded.
The oil-rich nations needed cash to fund governments and maintain their dollar pegs. The selling flooded the gold market and triggered the 1983 crash.
In 2026, the pressure on Gulf state finances comes from a different direction. In 1983, Gulf states could not sell oil at a high enough price because of a glut.
Today, oil prices are high, but Gulf states still cannot physically ship crude because the Strait of Hormuz remains disrupted.
Saudi Arabia and Kuwait have started cutting production as storage has filled. Almost every Gulf state pegs its currency to the US dollar, a policy which requires dollar reserves that oil sales normally replenish.
Oil revenue has stopped. Currency defence, infrastructure, banking solvency and military spending still require dollars. Asset sales are the remaining option.
Saudi Arabia has 300 tons of gold. Qatar has 115 tons.
Headlines have not confirmed specific sales. In Felix's view, the market behaviour is consistent with sovereign selling of the kind seen in 1983.
Paper versus physical divergence
Gold fell 9.4 per cent in a single week in the paper market. The weekly fall occurred on COMEX, in futures, in amplified ETFs and in derivative contracts. None of these instruments confer ownership of physical metal.
Physical gold is leaving the COMEX while the paper price crashes. Asian central banks, Chinese investors and Eastern buyers are purchasing at a discount.
The People's Bank made its largest monthly purchase in 3 years in September. Chinese households have also been buying the price dip.
The gold stress index picked up after the crash week. Exchanges can create and destroy paper contracts without limit, but the supply of metal is fixed.
The dollar, yields and what comes next
Two indicators matter for the direction of gold.
A dollar index above 100 is unfavourable, while below 96 or 97 is more favourable. Reports of continued disruption in the Strait of Hormuz and elevated shipping costs suggest the oil shock has not yet eased.
A 10-year Treasury rate above 4 per cent is also unfavourable. When a zero-risk asset yields that much, capital flows away from gold, which generates no income.
Felix argues that gold's recovery depends on the Federal Reserve being forced to cut rates. A recession, a credit event or an economy buckling under current rates could trigger that shift.
Until that moment arrives, the dollar and yield levels point against a rapid rebound. After the 1983 crash, gold did not bounce back quickly. It entered a bearish market for the rest of the decade.
The Strait of Hormuz disruption cut 20 per cent of global oil supply. Higher oil fed directly into consumer prices.
The Federal Reserve could not cut rates. Higher yields and a stronger dollar triggered algorithmic selling of paper gold.
Amplified ETF rebalancing turned the decline into a liquidation spiral. In Felix's view, the same disruption cut Gulf states off from oil revenue, forcing them to sell gold to raise dollars for their currency pegs.
Consequently, paper contracts fell 9.4 per cent in a week, while physical buyers in Asia accumulated metal at discounted prices. After the 1983 crash, gold entered a bearish market for the rest of the decade. A similar duration is plausible while the dollar index stays above 100 and Treasury yields remain at 4 per cent or higher.